“Stable (albeit Decelerating) Fundamentals”, “U.S. Hotels to Peak in Mid-2020”, “Good Enough: 2019 Setting Up to be a Replay of 2018” and “Outlook for 2019 is Positive But With Plenty of Bumps” are just some of the headlines providing a range of sentiments for the U.S. Lodging Industry over the next year or so.
Lodging industry participants can make better sense of the prognostications of industry soothsayers if they’re aware of mean-reversion, a financial theory suggesting that asset prices and returns eventually return back to the long-run mean or average of the entire dataset. See the footnote for a detailed explanation of the concept.
Mean-Reversion: The Search for Equilibrium
A time series, such as Real RevPAR, shows mean-reversion if it tends to fall when its level is above its mean and rise when its level is below its mean. The concept is illustrated in the graph below which shows the mean-reverting nature of Real RevPAR for the U.S. Lodging Industry since 1958.
Nominal or current RevPAR has grown from $8.45 in 1958 to $85.96 in 2018, a CAGR of 3.9% which compares with inflation with a CAGR of 3.7% over the same period. Adjusting nominal RevPAR for inflation it is easy to see that Real RevPAR has cycled around a long-term average of $72.56 ($2018). Real RevPAR has grown from $73.53 in 1958 to $85.96 in 2018, a CAGR of 0.3%.
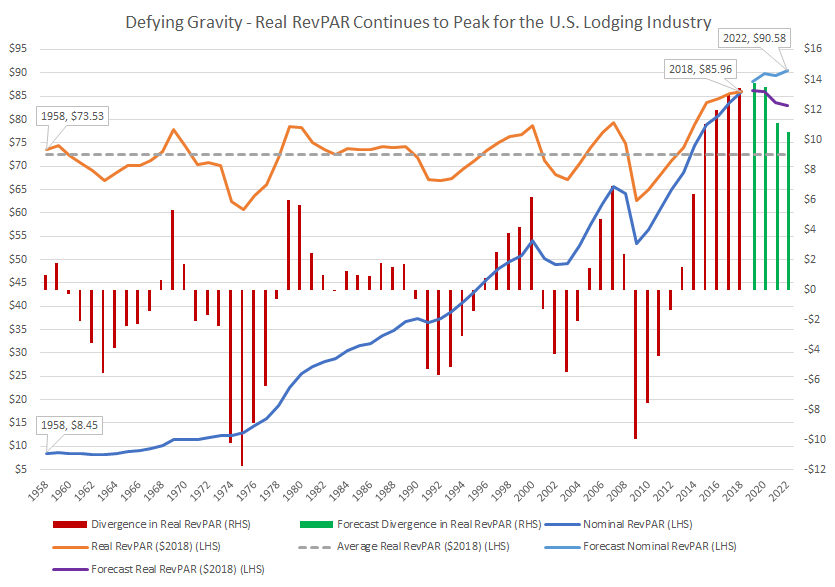
The graph clearly illustrates the years in which Real RevPAR was above the long term average. The red bars reflect the difference in actual Real RevPAR and the long term average of $72.56 ($2018). Real RevPAR was $13.40 ($2018) above the average in 2018, the highest recorded since 1958. Based on our forecasts for 2019-2022 we believe Real RevPAR will peak in 2019 at $86.30 ($2018), $13.74 above the long term average before it declines in 2020, 2021 and 2022.
Apart from its mean-reverting characteristic, annual Real RevPAR is auto correlated which means that it is correlated with itself. Annual Real RevPAR has a large positive autocorrelation of 0.80 at lag 1 year which means that Real RevPAR in successive years is correlated – if Real RevPAR in any year is high (or low), the following year’s Real RevPAR will tend to be high (or low). It also has a statistically significant negative autocorrelation at lags 4, 5 and 6 years of – 0.28, -0.45 and -0.38 respectively. This means that if Real RevPAR in any year is high (or low), Real RevPAR in subsequent years 4, 5 & 6 will tend to be low (or high).
Based on the mean-reverting nature of the U.S. Lodging Industry there is a 68% probability that future Real RevPAR will fall between $67.21 and $77.91 (one standard deviation) and a 95% probability that it will fall between $61.86 and $83.26 (two standard deviations).
The following table provides the results of our mean-reverting Real RevPAR simulation for the U.S. Lodging Industry. It can be used to determine how far Real RevPAR has diverged from its equilibrium state and the probability of further upside or downside. Providing a similar analysis at the metro, tract and competitive set level has proved to be a significant investment and asset management tool for investors.

If investors understood that real NOI is mean-reverting, they would expect high growth when real NOI is low and low growth when real NOI is high! Relatively high cap rates should be applied to high real NOI and relatively low cap rates should be used for low real NOI. Without a clear understanding of mean-reversion many investors are likely to repeat the mistakes of the past by undervaluing hotels near the bottom and overvaluing hotels near the peak of a market cycle. Supply, demand and mean-reversion are fundamental concepts of Hotel Investment 101! We trust you enjoyed the read!
Mean-Reversion
A time series shows mean-reversion if it tends to fall when its level is above its mean and rise when its level is below its mean. Therefore, a mean-reverting time series tends to return to its long-term mean, although its long-term average value is not the same as its mean-reverting level but in many instances they may be similar.
If a time series is currently at its mean-reverting level, then the model predicts that the value of the time series will be the same in the next period. At its mean-reverting level, we have the relationship xt+1=xt. For an autoregressive AR (1) model (xt+1=b0 +b1xt), the equality xt+1=xt implies the level xt=b0 +b1xt, or that the mean-reverting level xt, is given by xt=b0÷(1-b1). So the AR(1) model predicts that the time series will stay the same if its current value is b0÷(1-b1), increase if its current value is below b0÷(1-b1), and decrease if its current value is above b0÷(1-b1).
We now have sufficiently long time series to effectively determine the mean reverting value of occupancy, real ADR, real RevPAR, real expenses and income and hotel values.