Commercial Property Price Indices
Indonesia currently has the largest construction pipeline for hotels/rooms in South-east Asia. According to a recent report from Lodging Econometrics, Indonesia, with 400 projects/67,977 rooms accounts for 23% of Asia Pacific’s total current construction pipeline. Jakarta, with 99 projects/18,820 rooms has the largest construction pipeline of any city in Asia Pacific. It accounts for 25% of projects and 28% of rooms in Indonesia’s construction pipeline.
The major structural shifts in the supply of accommodation are exemplified by the significantly different growth rates in the supply of classified and non-classified hotels. Over the five years, 2011-2016, classified room supply grew by CAGR 10.3%, compared with 4.2% for the supply of non-classified rooms as illustrated in our report, “Short-Term Forecasts of Visitor Arrivals in Indonesia, 2018-2020”, which can be downloaded here.
With this significant expansion in the supply of hotels in Indonesia, there has been much commentary on the likely impact on hotel asset prices over the next couple of years. Much will depend on the growth in domestic travelers and foreign tourists especially in secondary cities throughout the country. Given the interest in future asset prices we decided to briefly review Bank Indonesia’s Commercial Property Survey, which provides quarterly updates on a price, supply and demand index for seven real estate asset classes, which includes hotels.
Price Indices
The four-quarter moving average year-over-year growth rate¹ for hotel property prices in Indonesia fell by 9.7% for the year ended 30 September 2018 according to our analysis of the latest Commercial Property Survey. This was a slight improvement on the rolling four-quarter annual declines of 13.5%, 14.2% and 12.1% for the years ending 4Q 2017, 1Q 2018 and 2Q 2018 respectively as illustrated in the graph below. The performance of the hotel sector is in marked contrast to the other property sectors where four-quarter moving average year-over-year prices grew marginally by 0.8%, 0.7% and 0.3% for industrial estates, apartments and offices respectively. Retail fell by 1.3%.
The overall commercial property price index rose by 0.4% for the year ended 3Q 2018, up from 0.2% for the year ended 2Q 2018. The slight improvement in the overall commercial property index was assisted by two segments, namely hotels and convention halls with correlation coefficients with the index of 0.47 and 0.49 respectively as illustrated in the correlation table below.
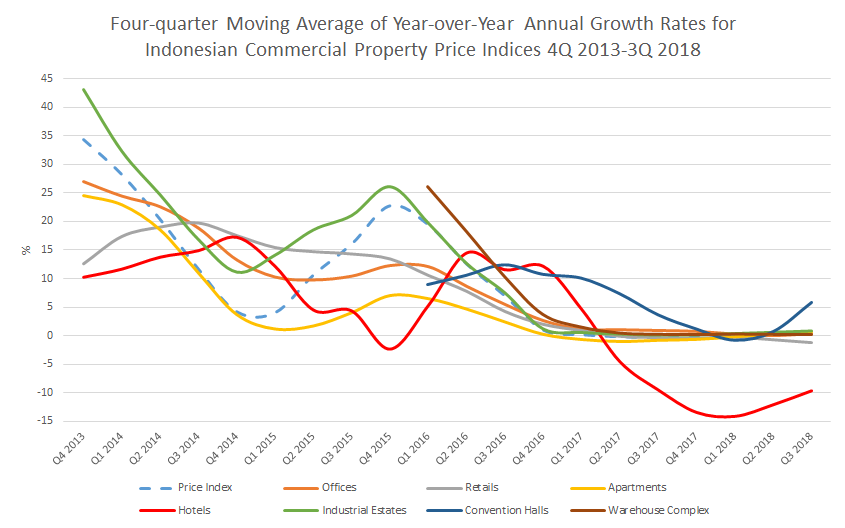
Source: Hotel Investment Strategies, LLC based on Bank Indonesia – Commercial Property Development Survey
The table below presents investors with diversified portfolios who seek a disproportionate return from capital appreciation, two important insights. Firstly, hotels and conventional halls had the lowest correlation coefficients with the broad commercial property market. Secondly, the growth in hotel prices were more correlated with retail (0.73) and offices (0.67) than apartments (0.49) and industrial estates (0.53).

Given the size of the Jabodetabek ² or Greater Jakarta hotel sector compared to the other major cities in Indonesia, the national hotel price index is highly correlated with Jakarta’s hotel price index as illustrated in the graph below and the following correlation matrix. The four-quarter moving average year-over-year growth rate¹ for hotel property prices in Jakarta fell by 10.6% compared to a decline of 9.7% for the Indonesia hotel price index for the year ended 30 September 2018.
The performance of the Jakarta hotel price index is in marked contrast to the other hotel price indices where four-quarter moving average year-over-year prices grew by 15.4%, 8.5%, 6.5% and 5.8%% for cities of Palembang, Balikpapan, Medan and Semarang respectively. It fell by 5.9%, 5.7% and 2.7% for the cities of Denpasar, Banten and Surabaya respectively.

Source: Hotel Investment Strategies, LLC based on Bank Indonesia – Commercial Property Development Survey
Now the most important factor influencing the risk of a hotel portfolio is the correlation between hotel returns. The risk of a portfolio can be reduced significantly if an investor can add hotels that are negatively correlated with currents holdings. However, the combination of less than perfectly correlated assets will also reduce risk. Those hotels that are negatively correlated should be highly prized and investors should be prepared to pay more to acquire these assets because of their diversification benefits. The contribution a hotel makes to a diversified portfolio should therefore be an important factor determining its price. While the correlation matrix below only references one component of return, namely capital appreciation, it provides the basis by which hotel markets could be added to a diversified portfolio.

Supply Indices
The four-quarter moving average year-over-year growth rate¹ for hotel property supply in Indonesia grew by 2.5% for the year ended 30 September 2018. Denpasar, the capital of Bali witnessed a supply growth of 14.1% for the year ended 30 September 2018, following a rolling four-quarter annual growth of 13.1% and 13.8% for the years ending 1Q 2018 and 2Q 2018 as illustrated in the graph below. Other cities with significant supply growth include Makassar 8.8%, Semarang (6.2%) and Surabaya (5.3%).

Source: Hotel Investment Strategies, LLC based on Bank Indonesia – Commercial Property Development Survey
Demand Indices
The four-quarter moving average year-over-year growth rate¹ for hotel property demand in Indonesia grew by 3.6% for the year ended 30 September 2018. The City of Denpasar witnessed a demand growth of 30.1% for the year ended 30 September 2018, following a rolling four-quarter annual growth of 18.3% and 30.5% for the years ending 1Q 2018 and 2Q 2018 as illustrated in the graph below. Other cities with significant demand growth include Balikpapan (18.7%), Surabaya (11.3%) and Palembang (10.5%). While the demand for star rated hotels in Indonesia has grown at CAGR 24.7% between 2012 and 2017, growth rates have varied considerably over the period from a high of 62.8% for Gorontalo Province to -1.2% in Maluku Utara as illustrated in our report, “Short-Term Forecasts of Visitor Arrivals in Indonesia, 2018-2020”, which can be downloaded here.

Source: Hotel Investment Strategies, LLC based on Bank Indonesia – Commercial Property Development Survey
¹ We prefer to use a four-quarter moving average of year-over-year growth rates because the data provided in the survey fluctuates considerably from quarter to quarter. A clearer picture emerges on the underlying trends when the data is aggregated by a four-quarter moving average.
² Jabodetabek or Greater Jakarta is an official and administrative definition of the urban area or megacity surrounding the Indonesia capital city, Jakarta. It includes DKI Jakarta, five cities and three regencies.[3] The area comprises Jakarta and parts of West Java and Banten provinces, specifically the three regencies Bekasi Regency and Bogor Regency in West Java, and Tangerang Regency in Banten. The area also includes Bogor, Depok, Bekasi, Tangerang and South Tangerang city.
Methodology
Commercial Property Development has been analyzed on a quarterly basis since the first quarter of 1996, covering five segments, namely offices, shopping center (retail), apartments, hotels and industrial estates. Data is collated through outsourcing using face-to-face and telephone interviews covering data on supply, occupancy and sales, as well as selling prices and commercial property rental rates. Data is processed using the weighted average of area and number of units for each commercial property segment. Data is collected to reveal the latest direction of inflationary pressures on commercial property as an indicator of asset price inflation. Makassar was included in the survey since the second quarter of 2014 along with Medan, Semarang and Surabaya in the first quarter of 2015, Balikpapan and Denpasar in the first quarter of 2017.
Since the third quarter of 2015, commercial property data has been prepared in terms of the Commercial Property Price Index (CPPI), consistent with improvements in terms of sampling methodology and data management of each property segment. The index is calculated using 2012 as the base year and capitalization value as the weighted average. The cities of Jabodebek, Banten, Bandung, Makassar, Medan, Semarang, Surabaya, Balikpapan, and Denpasar are used to calculate the Commercial Property Price Index (CPPI).
Sales and occupancy rates are calculated based on the ratio of the number of sold/occupied units and the cumulative supply (new supply and existing inventory). Please download the attached PDF file for further detailed information on the methodology used in the construction of the indies. Basic Information – Commercial Property Price Index