“We must welcome the future, remembering that soon it will be the past, and we must respect the past, remembering that it was once all that was humanly possible.”
George Santayana
We like to think that those who respect the past will know what to expect in the future. We’re convinced that using statistical forecasting to “study the past” will help you make better plans for the future. After all, the future belongs to those who forecast it!
Forecasting can be defined as the art of predicting the occurrence of events before they actually take place. Forecasts, therefore provide information which enable hotel investors and operators to make decisions prior to particular events which affect, or would be affected by, their decision. In this sense forecasting lies at the heart of the lodging industry. Without reliable forecasts of room occupancy, average daily rate and RevPAR, it is difficult, if not impossible to produce meaningful budgets or to formulate suitable policy prescriptions.
Improved forecast accuracy can lead to better staffing, purchasing, budgeting and ultimately better investment decisions. While the future is uncertain, we are able to present this uncertainty in a quantitative way. We represent uncertainty as a probability distribution. Two kinds of information are needed to describe the distribution: the point forecasts and the forecast interval (or confidence limits). A point forecast is the median value of the distribution of future values, and can be thought of as a best estimate of the future value. Its forecast interval describes the spread of the
distribution above and below the point forecast.
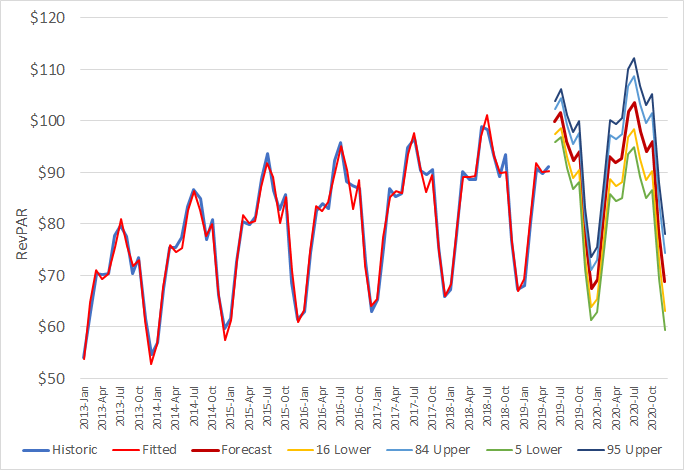
Let us illustrate the concept of confidence intervals by briefly examining the forecast of monthly RevPAR for the Total US Lodging Industry. Each confidence limit is associated with a certain percentile. The 84 Upper line represents a confidence limit of 84% and the 16 Lower line represents the lower confidence limit of 16%. This means that forecast RevPAR should fall above the upper confidence limit 16% of the time and below the lower confidence limit 16% of the time.
These are often called the 68% or one standard deviation confidence limits to indicate that the actual value should fall inside the confidence band 68% of the time. With a RevPAR forecast of $87.32 in 2019, there is about a 70% probability that RevPAR will fall between $85.72 and $89.47. With a RevPAR forecast of $88.89 in 2020, there is about a 70% probability that RevPAR will fall between $84.38 and $94.30.
Historic & Forecast Monthly RevPAR with Confidence Limits for the Total US Hotel Market 2013-2020
A wide variety of statistical forecasting techniques are available. All of them try to capture the statistical distribution that we have just discussed. All of these methodologies forecast the future by fitting quantitative models to the statistical patterns from the past. The forecast accuracy depends upon the degree to which the statistical model can detect and extract statistical patterns from the historic data.
The stronger these patterns are, compared to background irregularity, the more accurate the forecasts will be. While we use econometric models to forecast room supply, room demand, occupancy, ADR and RevPAR over the long-term (2 years or more), we prefer to use univariate models over the short to medium term (3 months to 2 years). Two of the most common univariate models are exponential smoothing and Box-Jenkins.
Exponential Smoothing models are widely applicable. They are also widely used, because of their simplicity, accuracy and ease of use. Their robustness makes them ideal even when the data are short and/or volatile. Box-Jenkins is a more elaborate statistical method than exponential smoothing.
Box-Jenkins works by capturing the historic correlations of the data, and extrapolating them forward. It often outperforms exponential smoothing in cases when the data are fairly long and nonvolatile.
Finally, the success of the forecasting effort will play a major role in determining the general success of a hotel investor or operator. We trust our latest forecasts provide you with a valuable tool. Our univariate forecasts for 2019 and 2020 are provided in the following table.
Comparison of Forecasts for the US Lodging Industry 2019 to 2020

The graphs and associated forecasting diagnostics for occupancy, ADR and RevPAR are provided below.
Historical & Forecast Room Occupancy for the Total US Hotel Market 1987-2020


Historical & Forecast ADR for the Total US Hotel Market 1987-2020


Historical & Forecast RevPAR for the Total US Hotel Market 1987-2020

