The Restaurant Industry
Franchising plays an important role in the U.S. Restaurant Industry. According to the 2012 U.S. Economic Census, franchise restaurants numbered almost 151,000 or about one third of all full¹ and limited-service² restaurants in the U.S. Franchising is much more prevalent in the limited-service sector with about 122,000 or 54% of the total number of limited-service restaurants, which numbered about 225,000 in 2012.
This compares with 29,000 or 12.5% of the total number of full-service restaurants which numbered almost 231,000. The map below illustrates the geographic distribution of full-service restaurants in the U.S. The number by state ranged from 554 in Wyoming to just over 28,000 in California.
The Number of Full-Service Restaurants by State 2012
(Scroll over a state to highlight details)
[visualizer id=”882″]
Despite the role played by franchise restaurants, there is little information available on the efficiency³ of full-service franchise restaurants compared to full-service non-franchise restaurants. Our post therefore examines the effects of franchising on the efficiency of full-service restaurants at the state level. We do this by using a series of Data Envelopment Analysis models to measure the aggregate efficiency of restaurants at the state level. We first examine all full-service restaurants and follow by comparing the efficiency of non-franchise restaurants with franchise restaurants. Finally, we examine the difference in efficiency of franchisee-owned restaurants and franchisor-owned restaurants.
Data released in the 2012 Economic Census for Accommodation and Food Services was used in our analysis. Full-service restaurants comprise establishments primarily engaged in providing food services to patrons who order and are served while seated (i.e., waiter/waitress service) and pay after eating. These establishments may provide this type of food service to patrons in combination with selling alcoholic beverages, providing carry out services, or presenting live nontheatrical entertainment.
Based on our analysis of the aggregate performance of full-service restaurants at the state level, we find a statistically significant difference between the mean efficiency of franchise and non-franchise full-service restaurants, with non-franchise full-service restaurants slightly more efficient than franchise full-service restaurants (Two-tailed p value = 0.03722). We also demonstrate that of the franchise full-service restaurants, the franchisee-owned restaurants were more efficient that the franchisor-owned restaurants.
Data Envelopment Analysis
For the purposes of determining the efficiency of the full-service restaurant industry in each state, we used Data Envelopment Analysis (DEA). DEA is a non-parametric linear programming technique that computes a comparative ratio of outputs to inputs for each unit (state in our case), which is reported as the relative efficiency score. The efficiency score is usually expressed as either a number between zero and one or 0 and 100%. A unit (state) with a score less than one is deemed inefficient relative to other units (states). DEA’s main usefulness, however, lies in its ability to generate potential improvements (i.e. achievable targets) for inefficient units and identifying the units to benchmark. DEA modeling allows for the selection of inputs and outputs. For the purpose of choosing a final set of inputs and outputs we examined:
- Non-discretionary or uncontrolled inputs (number of restaurants, population and medium household income)
- Discretionary or controllable inputs (annual payroll, number of paid employees and number of seats), and
- Outputs (value of sales)
Our final model used three inputs; number of restaurants, state population, annual payroll and one output; sales. Detailed statistics for the inputs and outputs for each of the states are found in the table at the bottom of the post. The data set was analyzed under the assumptions of input minimization and variable returns to scale. For an explanation of how DEA has been used to determine the efficiency of individual restaurants, please refer to the articles listed at the end of the post.
Results
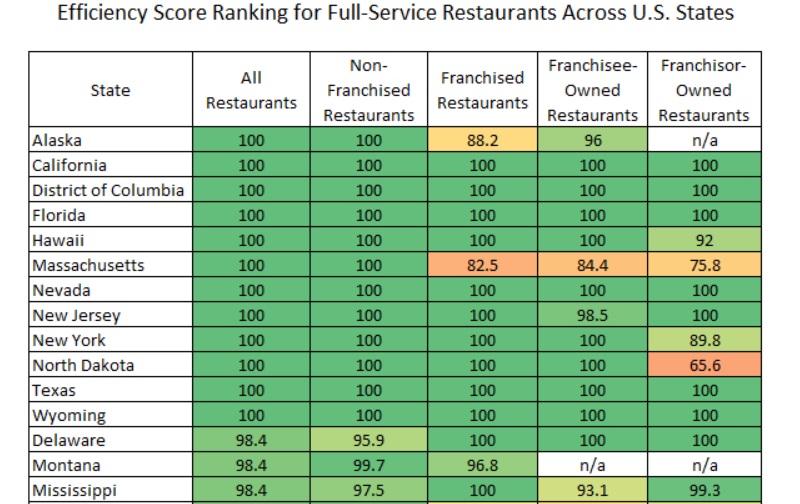
The following table shows the relative efficiency scores for the different sectors of the full-service restaurant industry in each of the 51 states. The full-service restaurant industry in twelve states, including California, New York, Texas and Florida was deemed efficient, while in 39 it was deemed inefficient with and average efficiency score of 90.5%.
Efficiency Score Ranking for Full-Service Restaurants Across U.S. States
| State | All Restaurants | Non-Franchise Restaurants | Franchise Restaurants | Franchisee-Owned Restaurants | Franchisor-Owned Restaurants |
|---|---|---|---|---|---|
| Alaska | 100 | 100 | 88.2 | 96 | n/a |
| California | 100 | 100 | 100 | 100 | 100 |
| District of Columbia | 100 | 100 | 100 | 100 | 100 |
| Florida | 100 | 100 | 100 | 100 | 100 |
| Hawaii | 100 | 100 | 100 | 100 | 92 |
| Massachusetts | 100 | 100 | 82.5 | 84.4 | 75.8 |
| Nevada | 100 | 100 | 100 | 100 | 100 |
| New Jersey | 100 | 100 | 100 | 98.5 | 100 |
| New York | 100 | 100 | 100 | 100 | 89.8 |
| North Dakota | 100 | 100 | 100 | 100 | 65.6 |
| Texas | 100 | 100 | 100 | 100 | 100 |
| Wyoming | 100 | 100 | 100 | 100 | 100 |
| Delaware | 98.4 | 95.9 | 100 | 100 | 100 |
| Montana | 98.4 | 99.7 | 96.8 | n/a | n/a |
| Mississippi | 98.4 | 97.5 | 100 | 93.1 | 99.3 |
| Maryland | 98.3 | 98.4 | 90.6 | 89 | 85.3 |
| Pennsylvania | 96.6 | 98.3 | 85.7 | 84.5 | 80.4 |
| Rhode Island | 95.2 | 94.7 | 96.3 | 83.6 | 71.2 |
| South Dakota | 95 | 95.3 | 95.8 | 93.5 | 100 |
| Illinois | 94.1 | 94.9 | 89.8 | 82.2 | 98.2 |
| West Virginia | 94 | 94.6 | 86.4 | 85 | 88.8 |
| Vermont | 92.5 | 90.4 | 100 | 88.2 | 84 |
| Virginia | 92.5 | 92 | 97.2 | 100 | 73.9 |
| Georgia | 92.1 | 93.4 | 100 | 100 | 82.8 |
| Arkansas | 92 | 92 | 89.2 | 91.6 | 68.9 |
| Connecticut | 91.9 | 93.1 | 81.7 | 85 | 68.7 |
| Wisconsin | 91.8 | 94.2 | 79.3 | 81.4 | 59.3 |
| South Carolina | 91.6 | 93.4 | 87.6 | 87.4 | 73.3 |
| Oklahoma | 91.5 | 92 | 90.4 | 89.1 | 80.2 |
| Ohio | 91.5 | 88.8 | 100 | 92.5 | 100 |
| Idaho | 91.3 | 90.5 | 85.4 | 87.2 | 51.4 |
| Nebraska | 91.2 | 94.3 | 75.2 | 72.3 | 76.2 |
| North Carolina | 90.2 | 90.2 | 94.2 | 92.4 | 82.6 |
| Alabama | 89.9 | 88.7 | 96.9 | 100 | 73.1 |
| Michigan | 89.7 | 91.7 | 87.9 | 91.2 | 68.3 |
| Louisiana | 89.4 | 89 | 88.9 | 85.7 | 91.3 |
| Kentucky | 89.2 | 89.9 | 93 | 92 | 92.7 |
| Kansas | 88.6 | 89.4 | 89.6 | 94.1 | 69.4 |
| Iowa | 88.4 | 90.3 | 84.6 | 88.2 | 63.8 |
| Indiana | 88.2 | 86.7 | 100 | 100 | 100 |
| Oregon | 86.8 | 87.6 | 82.2 | 77.4 | 100 |
| Minnesota | 86.5 | 87 | 86.1 | 82 | 85.9 |
| Tennessee | 86.4 | 85.7 | 91.7 | 94.1 | 83.6 |
| Missouri | 85.8 | 86.9 | 88.7 | 86.8 | 77.8 |
| Maine | 85.6 | 86.1 | 72.5 | 75.3 | 58 |
| New Mexico | 85 | 85.7 | 78 | 77.6 | 73.3 |
| Colorado | 84.9 | 84.7 | 83.2 | 81.7 | 74.9 |
| Utah | 84.9 | 85.5 | 75.2 | 76.7 | 67.5 |
| Arizona | 83.8 | 83.6 | 84 | 83.7 | 72.5 |
| New Hampshire | 83.6 | 83.7 | 72.9 | 75.2 | 71.9 |
| Washington | 82.8 | 82.7 | 82.8 | 82.1 | 78.5 |
| Average | 92.7 | 92.9 | 90.8 | 90.0 | 82.7 |
Please feel free to download the heat-map of efficiency scores for full and limited service restaurants across U.S. states: Efficiency Score Ranking for Full & Limited Service Restaurants Across U.S. States
Using a paired t test we found the difference in mean efficiencies for non-franchised and franchised full-service restaurants to be statistically significant (two-tailed P value 0.0372). The difference in mean efficiencies for franchisee-owned and franchisor-owned full-service restaurants were found to be extremely statistically significant (two-tailed P value 0.0001).
Summary statistics for the DEA technique are found in the following table. The mean efficiency score of 92.7 for all full-service restaurants suggests that the average full-service restaurant is 92.7% efficient compared with the most efficient full-service restaurants. The average efficiency score for the states with an inefficient full-service restaurant sector ranges from 90.7% in the case of non-franchise restaurants to 77% in the case of franchisor-owned restaurants.
Descriptive Data on Efficiency Scores for Full-Service Restaurants Across U.S. States
| Variable | All Restaurants | Non-Franchise Restaurants | Franchise Restaurants | Franchisee-Owned Restaurants | Franchisor-Owned Restaurants |
|---|---|---|---|---|---|
| Average | 92.7 | 92.9 | 90.8 | 90.0 | 82.7 |
| Standard Deviation | 5.6 | 5.6 | 8.4 | 8.3 | 13.8 |
| Maximum | 100 | 100 | 100 | 100 | 100 |
| Minimum | 82.8 | 82.7 | 72.5 | 72.3 | 51.4 |
| Average Inefficient | 90.5 | 90.7 | 86.6 | 86.1 | 77.0 |
Characteristics of Full-Service Restaurants by State
| State | Number of Restaurants | Number of seats as of December 31 | Value of sales, shipments, receipts, revenue, or business done ($1,000) | Annual payroll ($1,000) | Number of paid employees for period including March 12 | Population |
|---|---|---|---|---|---|---|
| Alabama | 2804 | 234199 | 2467928 | 818447 | 60235 | 4813946 |
| Alaska | 560 | 43720 | 529333 | 168060 | 7989 | 730825 |
| Arizona | 3882 | 384095 | 4085218 | 1465341 | 96172 | 6544211 |
| Arkansas | 1940 | 141962 | 1392695 | 457419 | 35920 | 2949208 |
| California | 28089 | 2324376 | 28512017 | 9423933 | 548250 | 38019006 |
| Colorado | 4691 | 427086 | 4555946 | 1634848 | 102253 | 5186330 |
| Connecticut | 3336 | 248412 | 2871363 | 931079 | 53056 | 3597705 |
| Delaware | 741 | 76379 | 844515 | 265709 | 17296 | 916868 |
| District of Columbia | 734 | 97860 | 1368521 | 472738 | 23174 | 635630 |
| Florida | 14747 | 1442909 | 17058969 | 5616507 | 342226 | 19341327 |
| Georgia | 6720 | 573496 | 6443555 | 2110791 | 144478 | 9911171 |
| Hawaii | 1204 | 128755 | 1968924 | 595675 | 32893 | 1392772 |
| Idaho | 1219 | 81635 | 790891 | 267894 | 20376 | 1594673 |
| Illinois | 9061 | 792952 | 8977494 | 2954577 | 185476 | 12878494 |
| Indiana | 4419 | 399612 | 4036660 | 1355818 | 103447 | 6535665 |
| Iowa | 2521 | 172795 | 1645029 | 559487 | 46104 | 3074386 |
| Kansas | 2090 | 165884 | 1622455 | 551169 | 45013 | 2885316 |
| Kentucky | 2598 | 241904 | 2512586 | 840348 | 62168 | 4383673 |
| Louisiana | 2747 | 244159 | 2913546 | 972140 | 64924 | 4602681 |
| Maine | 1441 | 99004 | 1006254 | 359897 | 21647 | 1328101 |
| Maryland | 3344 | 371284 | 4313967 | 1395097 | 85402 | 5891680 |
| Massachusetts | 6110 | 562020 | 6591139 | 2152018 | 122983 | 6659627 |
| Michigan | 6908 | 570217 | 5914359 | 1945506 | 144145 | 9886610 |
| Minnesota | 3768 | 362076 | 3714755 | 1274462 | 88391 | 5377695 |
| Mississippi | 1636 | 123139 | 1313236 | 404068 | 30964 | 2982963 |
| Missouri | 4559 | 380020 | 3870910 | 1336157 | 98456 | 6023267 |
| Montana | 1059 | 74814 | 774358 | 244044 | 17285 | 1003522 |
| Nebraska | 1415 | 111424 | 1052007 | 352086 | 28315 | 1854862 |
| Nevada | 1730 | 218655 | 2865428 | 981347 | 48524 | 2752410 |
| New Hampshire | 1258 | 110859 | 1135100 | 414507 | 24552 | 1320923 |
| New Jersey | 6906 | 539958 | 6203769 | 1829403 | 108442 | 8882095 |
| New Mexico | 1315 | 110163 | 1163991 | 416149 | 29155 | 2083590 |
| New York | 18899 | 1387724 | 17939912 | 5751488 | 293893 | 19625409 |
| North Carolina | 7213 | 585119 | 6266053 | 2050425 | 147566 | 9755299 |
| North Dakota | 555 | 51161 | 510341 | 178189 | 12955 | 701380 |
| Ohio | 7248 | 692797 | 7430273 | 2518036 | 181909 | 11546969 |
| Oklahoma | 2450 | 197177 | 2125750 | 694188 | 54327 | 3815298 |
| Oregon | 3960 | 268022 | 2910284 | 998632 | 59793 | 3893920 |
| Pennsylvania | 9315 | 746699 | 8295469 | 2616853 | 189426 | 12768034 |
| Rhode Island | 1114 | 87047 | 984932 | 318058 | 19832 | 1052761 |
| South Carolina | 3720 | 304584 | 3250899 | 1053779 | 75062 | 4719009 |
| South Dakota | 718 | 51544 | 491816 | 167120 | 13119 | 832576 |
| Tennessee | 4231 | 402991 | 4276886 | 1476646 | 99547 | 6450632 |
| Texas | 16128 | 1632185 | 17939115 | 5837544 | 391151 | 26078327 |
| Utah | 1480 | 126308 | 1295698 | 462097 | 33961 | 2854222 |
| Vermont | 717 | 43399 | 450250 | 160902 | 10439 | 625606 |
| Virginia | 6336 | 545945 | 6044782 | 1962725 | 132344 | 8188656 |
| Washington | 5612 | 431397 | 4873658 | 1739750 | 93704 | 6890899 |
| West Virginia | 1146 | 84884 | 934800 | 304956 | 23296 | 1855360 |
| Wisconsin | 4979 | 351192 | 3375475 | 1090733 | 90932 | 5721075 |
| Wyoming | 554 | 38169 | 407488 | 138001 | 9327 | 576608 |
¹ Full-service restaurants comprise establishments primarily engaged in providing food services to patrons who order and are served while seated (i.e., waiter/waitress service) and pay after eating. These establishments may provide this type of food service to patrons in combination with selling alcoholic beverages, providing carry out services, or presenting live nontheatrical entertainment.
² Limited-service industry comprise establishments primarily engaged in providing food services (except snack and nonalcoholic beverage bars) where patrons generally order or select items and pay before eating. Food and drink may be consumed on premises, taken out, or delivered to the customer’s location. Some establishments in this industry may provide these food services in combination with selling alcoholic beverages.
³ Productivity and efficiency are used interchangeably throughout the post. Efficiency refers to the ability to convert multiple inputs into outputs.
References
An Empirical Examination Of Productivity Of A Chain Restaurant Using Data Envelopment Analysis (DEA)
Multi-unit Restaurant-productivity Assessment: A Test of Data-envelopment Analysis
Measuring Efficiency Of Restaurants Using The Data Envelopment Analysis Methodology