Over the past couple of decades, the hotel industry in China has witnessed phenomenal growth, with the number of five-star hotels growing from 64 in 1998 to 816 in 2017, a CAGR of 14.3%. Over the same period, the number of five-star hotel rooms has grown from 30,966 to 286,400 representing a CAGR of 12.4%. The growth in four-star hotels has mirrored that of the five-star category with the number of four-star hotels growing from 176 in 1998 to 2,412 in 2017, a CAGR of 14.8%, while over the same period the number of four-star rooms has grown from 60,536 to 503,700 representing a CAGR of 11.8%.
By contrast, the number of low-end hotels, such as one and two-star hotels has dropped dramatically, especially over the past ten years. The number of one and two-star hotels has declined from 6,134 in 2008 to 1,724 in 2017 representing a CAGR of -13.2%. The number of one and two-star hotel rooms has similarly declined from 417,923 in 2008 to 127,800 in 2017, a CAGR of -12.3%. Despite China’s burgeoning hotel industry, especially in the four and five-star bracket, total profits for star-rated hotels have fluctuated wildly as illustrated in the graph below. Hotel profits rebounded in 2017 to reach an all-time high of 7.2 billion RMB after experiencing threes years of losses.

The recent record in hotel profits has been a major catalyst for new hotel developments. According to analysts at Lodging Econometrics (LE), the total China construction pipeline stands at 2,523 projects/556,645 rooms. At the second quarter of 2018, the construction pipeline is slightly less than the all-time high of 2,658 projects/557,716 rooms set in the fourth quarter of 2014 and is up 5% by projects year-over-year (YOY).
Projects presently under construction are at 1,814 projects/389,328 rooms, projects starting construction in the next 12 months are at 367 projects/78,361 rooms, and projects in the early planning stage are at 342 projects/88,956 rooms. Despite an economic slowdown, a falling stock market, and continued concerns about a possible war on tariffs, pipeline totals remain at or near all-time highs, as the hotel construction boom continues. Despite the positive outlook for China’s hotel industry, many observers are concerned about the potential for excess capacity and the effect this may have on operational efficiency levels of hotels across China’s provinces, leading to less efficient operations and sub-optimal industry performance.
Our brief analysis, therefore, examines star-rated hotel efficiency across China’s provinces using the Data Envelopment Analysis (DEA) technique. Download a copy of our article, “Improving the Efficiency & Profitability of Hotel Portfolios”. DEA & Productivity – Brief 2018 DEA is a powerful benchmarking tool to identify best practices and organizational inefficiencies. It is a linear programming-based methodology by which diverse operations’ efficiency can be evaluated effectively.
DEA was used to measure overall efficiency (OE), pure technical efficiency (PTE), and scale efficiency (SE) for star-rated hotels by province for 2016, the latest year for which data is available. For all of the regions, overall efficiency refers to the extent to which a region achieves its overall productivity attainable in the most efficient manner. The overall efficiency is further divided into two components: pure technical efficiency and scale efficiency. Pure technical efficiency provides the efficiency with which a region’s hotel industry uses its inputs. Scale efficiency was used to measure how scale impacts a region’s productivity; it is the ratio of OE from a constant-return-to-scale (CRS) model to PTE from a variable-return-to-scale (VRS) model. (Overall Efficiency = Pure Technical Efficiency x Scale Efficiency)
Our analysis used three input indicators: (1) total number of full-time employees for a region’s hotel industry, (2) total number of guest rooms in the star-rated hotels in a region, and (3) total fixed assets in a region’s hotel industry. The number of hotel rooms represents the level of supply accommodation while the amount of fixed assets and the number of employees represents hotels’ investments in service capacity and human capital, respectively.
Two output indicators were used: (1) total revenue, the revenue generated by room occupancy, food and beverage service, and other revenues from laundry and service fees, and (2) average occupancy as a percentage of total available room-nights. Total revenue is therefore used as a direct measure of hotel output and the occupancy percentage is another commonly used performance measure for hotels.
A total of 31 regions were included, including 22 provinces (e.g., Guangdong, Yunnan), 4 municipalities (e.g., Beijing, Shanghai), and 5 autonomous regions (e.g., Guangxi, Xinjiang). Descriptive statistics of the inputs and outputs for 2016 are provided in the table below. For the 31 regions, the total number of hotel employees ranged from 3,869 (Tibet) to 122,867 (Guangdong). The total number of guest rooms varied from 6,812 (Tibet) to 121,437 (Guangdong), and hotel fixed assets ranged from 1,747 million RMB (Qinghai) to 66,044 million RMB (Beijing). Tibet was found to produce the least amount of outputs in terms of total revenue (558 million RMB), while Beijing generated the most revenue at 25,360 million RMB. Annual occupancy ranged from a low of 43% (Qinghai) to a high of 68.3% (Shanghai).

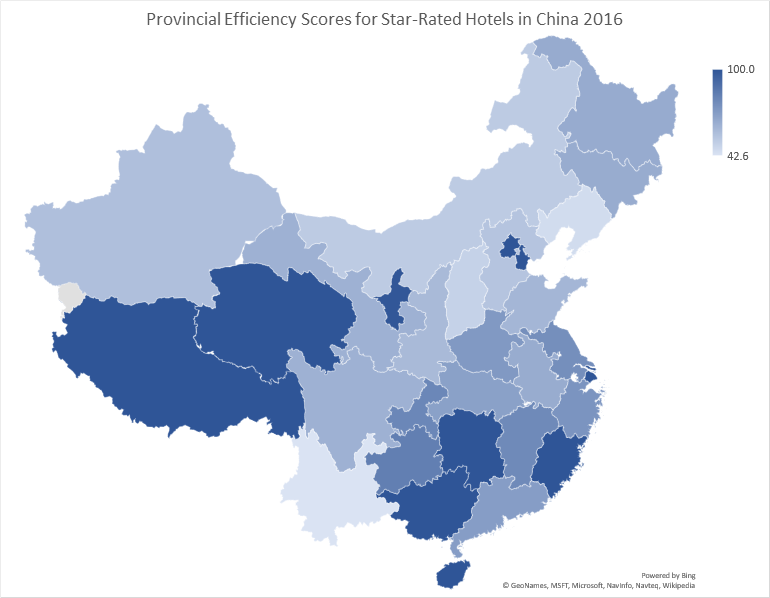
The production efficiency of the Chinese hotel industry for 2016 is outlined in the following table. Only four of the 31 regions (namely, Shanghai, Tibet, Fugian and Qinghai)obtained an overall efficiency of 100%, which represents the optimal allocation in input resources. The overall efficiency scores in the remaining 28 regions are less than 100%, indicating that their production is relatively inefficient.
The ranking of regions by pure technical efficiency reveals the diffusion of best-practice technology in China’s hotel operations among the 31 regions. Out of 31 regions, nine or about 29% of them received a PTS score of 100%. Specifically, Yunnan’s hotel industry is found to operate in the poorest level of pure technical efficiency devoid of scale efficiency, of which the PTE score is only 42.6%. Four regions (Tibet, Fujian, Qinghai, and Shanghai) that have OE and PTE scores of 100% achieve scale efficiency as well. This illustrates that the hotel industry within these regions operates at the constant return to scale size. That is, when changing all inputs (e.g., fixed assets, number of rooms or employees) by a positive proportional factor, the outputs (e.g., total revenue and room occupancy) within the regional hotel industry will increase by the same proportional amount.

K-means cluster analysis has been used to define cluster membership of the 31 regions in China based on annual PTE’s over the period 2003-2016. A three-cluster solution provided the best group aggregations as well as separations as illustrated in the table and graph below. For cluster 1 of high efficiency, 12 regions were identified, including seven eastern regions (Shanghai, Tianjin, Beijing, Zhejiang, Jiangsu, Fujian, and Guangdong), and four western regions (Qinghai, Ningxia, Tibet and Guizhou), Only one region, Hunan, came from the central region of China. The average PTE scores for cluster 1 regions ranged from a high of 100% for Qinghai and Shanghai to a low of 83.6% for Guangdong over the period 2003-2016. Cluster 1 regions were the most consistent in terms of annual efficiency performance over the period, followed by cluster 3 regions.
Cluster 2 (medium efficiency) included four regions from central China (Henan, Shanxi, Anhui and Jiangxi), two from eastern China (Hainan and Shandong), and one from western China (Chongqing). The average PTE scores for cluster 2 regions ranged from a high of 83.4% for Henan to a low of 75% for Jiangxi over the period 2003-2016. Cluster 2 regions were the most volatile in terms of annual efficiency performance over the period.

The annual average efficiency scores for each of the clusters are illustrated in the accompanying graph. The average efficiency score grew from 65.2% in 2003 to a high of 89% in 2012. It has fallen each year since 2012 and was 75.7% in 2016. The average efficiency score for cluster I regions grew from 85.3% in 2003 to a high of 99.8% in 2012 and 2013. It has fallen marginally and was 92% in 2016. Cluster 3 (low efficiency) includes five regions from Western China (Guangxi, Xinjiang, Sichuan, Gansu, and Yunnan) and five regions from Central China (Jilin, Hubei, Inner Mongolia, Shaanxi and Heilongjiang). Based on the average efficiency level for Cluster 3 regions of 63.8% there is considerable scope for efficiency gains and expense savings. Average efficiency scores for the cluster grew from 48.5% in 2003 to 78.2% in 2012 and have fallen to 61.4% in 2016.

Despite the volatility of profits for star-rated hotels in China and the significant growth in the supply of 4 and 5-star hotels over the past couple of decades, the average efficiency scores for hotels across the provinces have improved over the period. Despite the improvement in efficiency levels across the provinces there remains significant scope for efficiency gains and expense savings for a large number of hotels within the provinces.
Please contact us if you would like to review a copy of the “deliverables” for a typical efficiency and targeted expense savings analysis for a hotel portfolio. The report titled, “Hotel Efficiency Rankings & Targeted Expense Savings for the Capital Hotel Portfolio” provides our detailed analysis of the relative efficiency of the Operated Departments for a portfolio of 24 full-service hotels; Rooms and Food & Beverage and the Undistributed Operating Departments; Laundry, Administrative & General, Marketing, Property Operations & Maintenance, and Energy. It also provides the target input and output levels for a department to become “fully” efficient based on the performance of a department’s peer hotels.
Our customized DEA model is able to identify significant expense savings not identifiable with traditional financial and operating ratio analysis. Why? Because it calculates efficiency based on observed best practice – not an ‘average’ or ‘ideal’ models and simultaneously accounts for the interactions and substitutions between multiple inputs and multiple outputs. Single-factor productivity measures, which are the staple of operating ratio analysis, are unable to do this!