Background
About twelve months ago the American Hotel & Lodging Association (AH & LA) released a comprehensive report which examined the economic impact of the U.S. hotel industry¹ in 2015. According to the report, “Economic Impact of the U.S. Hotel Industry” prepared by Oxford Economics, the U.S. hotel industry had a significant economic impact as summarized below:
- More than one billion guests stay in hotels every year.
- Hotels support $1.1 trillion of U.S. sales, including hotel revenue, guest spending and taxes.
- 7.8 million jobs with $355 billion of labor income.
- Guests spend $483 billion at hotels and local businesses.
- Hotels contribute $589 billion to U.S. GDP.
- Hotels generate $167 billion in local, state and federal taxes.
The report assesses direct effects² of the hotel industry – hotel operations, hotel guest ancillary spending (guest spending at hotels and local businesses, and on transportation), and capital investment (investment in the construction of new hotels, and renovation of existing hotels excluding maintenance). It also provides estimates of the downstream impacts, including indirect² and induced effects², using IMPLAN, an economic impact model. Finally, it provides estimates of fiscal impacts², based on estimates of specific taxes (e.g. taxes on lodging and hotel property taxes, and other taxes derived from the economic impact model.
A supplementary report includes a snapshot of hotel-related economic activity for all 50 states and the District of Columbia. The state-level estimates are based on the same methodology used to derive the national estimates and represent direct and indirect expenditures on hotel-related economic activities.
These state-level primary expenditures were entered into the model for each state to produce estimates of the secondary effects of the expenditures on economic output, labor income, employment and GDP. These secondary impacts, or induced impacts, comprise spending by businesses and individuals who receive hotel-related direct and indirect expenditures as revenue or earnings. The sum of the primary and secondary impacts equals the total economic impact of the hotel industry on a state’s economy. Based on the structure of the economic model, an estimate of value-added activities within the hotel industry sector is used to identify the contribution of hotel-related economic activity.
Nationally, the hotel industry contributed 3.2% to GDP, but at the state level, the contribution ranged from a high of 19.5% in the case of Nevada, to a low of 1.8% in the case of Delaware. The disparity in the hotel industry’s contribution to GDP in each state leads to the question, “How efficient is the hotel industry in each state in converting inputs, such guest nights, hotel revenue and hotel employment, into outputs, such as total impact employment and GDP”?
To help answer the question, we turn to Data Envelopment Analysis (DEA), a performance measurement tool we have used successfully to improve hotel productivity and identify significant annual expense saving not identifiable with traditional financial and operating ratio analysis. For an explanation of how DEA has been used to determine the efficiency of individual hotels, please refer to the articles listed at the end of the post.
Data Envelopment Analysis
DEA is a non-parametric linear programming technique that computes a comparative ratio of outputs to inputs for each unit (a state’s hotel industry in our case) which is reported as the relative efficiency score. The efficiency score is usually expressed as either a number between zero and one or 0 and 100%. A state’s hotel industry with a score less than one is deemed inefficient relative to other states. DEA does not require any assumption about the explicit functional form between inputs and outputs.
An efficient state’s hotel sector is one which produces a maximum amount of output, while utilizing a minimum amount of inputs. A “best practice” envelop is constructed from the most efficient states. States lying below the output surface are deemed inefficient and their distance to the frontier is a measure of the degree of their inefficiency. Moreover, states with an inefficient hotel sector can be examined in order to identify the sources of inefficiencies in terms of output augmentations or input reductions required for these states to reach the efficient frontier. Detailed hotel-related statistics for the inputs and outputs used for each of the state’s are found in the accompanying AH & LA report..
Our final models used the following inputs and outputs:
- Hotel Operations Efficiency (inputs: guest rooms, guest nights, hotel employment; outputs: occupancy, hotel operations output)
- Hotel Operations Super Efficiency (inputs: guest rooms, guest nights, hotel employment; outputs: occupancy, hotel operations output)
- Direct Impact Efficiency (inputs: guest nights, guest spending, capital investment, hotel employment, hotel operations output; output: direct impact GDP)
- Total GDP Efficiency (inputs: guest nights, guest spending, capital investment, hotel employment, hotel operations output; output: total impact GDP)
- Total Tax Efficiency (inputs: guest nights, guest spending, capital investment, hotel employment, hotel operations output; output: total impact taxes (local, state and Federal)
- Total Employment Efficiency (inputs: guest nights, guest spending, capital investment, hotel employment, hotel operations output; output: total impact employment)
The relative efficiency of the hotel industry in each state can be measured by either assuming constant returns to scale or variable returns to scale. Under the assumption of variable returns to scale, a state’s hotel industry found to be inefficient has its efficiency measured relative to other states in the data-set of a similar scale size only. Whereas under the assumption of constant returns to scale a state’s efficiency is measured relative to states of all different scale sizes. As a result no state obtained a lower efficiency score using variable returns to scale than it achieved using constant returns to scale and some states are likely to achieve higher efficiency results.
Our optimization models sought to minimize inputs to produce the same outputs and utilized the variable returns to scale option (outputs fall off as input levels rise, i.e. doubling input produces less than double outputs.) The data set was analyzed under the assumptions of input minimization and variable returns to scale.
Results
Our DEA models treat each state’s hotel industry as a decision making unit for the purpose of determining the efficiency of the hotel industry in aggregate at the state level. Based on the inputs and outputs listed above for the six DEA models, an efficient frontier was constructed which comprised states which used as little input as possible while producing as much output as possible.
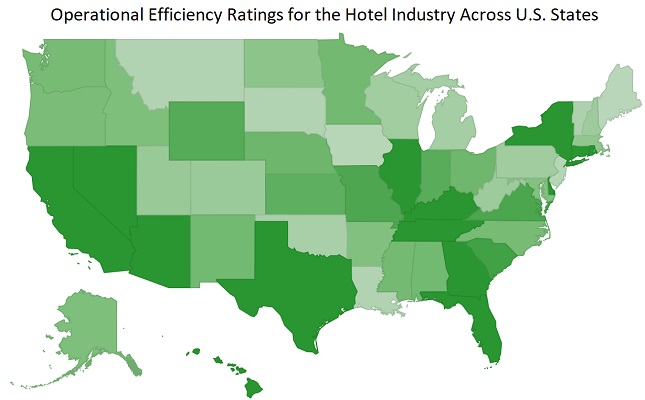
The following table shows the relative efficiency scores for the different levels of economic impact for the hotel industry in each of the 51 states. The hotel industry in 15 states, including California, Texas, Florida and New York were deemed efficient, while 36 states were deemed operationally inefficient with an average efficiency score of 83.5%.
Super efficiency is used to break the tie of states that are efficient when using the simple DEA envelopment model. In other words, if five states are efficient with a score of 1, then super efficiency will rank them from best to worst, with the highest score being the best. Of the 15 states deemed efficient, five had the best super efficiency score (California, Florida, Hawaii, Nevada and Texas).
Efficiency Score Ranking for the Hotel Industry Across U.S. States
Source: Hotel Investment Strategies, LLC based on an analysis of data in the report "Economic Impact of the US Hotel Industry" funded by the American Hotel and Lodging Association Educational Foundation and undertaken by Oxford Economics.
State Hotel
Operations
EfficiencyHotel
Operations
Super EfficiencyDirect
Impact
EfficiencyTotal GDP
EfficiencyTotal Tax
EfficiencyTotal
Employment
Efficiency
Arizona 100 103.6 91.6 100 97.5 100
California 100 1000 100 100 100 100
Connecticut 100 144.6 80.0 98.2 100 91.2
Delaware 100 118.9 100 100 100 100
District of Columbia 100 232.8 100 85.4 73.9 75.1
Florida 100 1000 92.0 81.8 78.8 95.9
Georgia 100 205.4 100 100 100 100
Hawaii 100 1000 100 94.1 97.1 100
Illinois 100 103.8 100 100 100 100
Kentucky 100 103.3 91.8 88.7 100 97.3
Nevada 100 1000 100 84.1 95.3 89.9
New York 100 102.9 100 100 100 100
Rhode Island 100 345.5 100 100 100 100
Tennessee 100 102.0 87.5 78.1 80.2 90.5
Texas 100 1000 100 100 100 100
South Carolina 96.3 96.3 84.4 70.4 75.6 88.4
Virginia 94.6 94.6 90.3 90.4 90.3 94.0
Missouri 94.2 94.2 73.8 75.7 84.0 85.3
Wyoming 93.0 93.0 91.6 70.1 97.9 84.9
Indiana 92.5 92.5 66.1 77.8 92.4 86.5
Kansas 91.4 91.4 87.6 91.1 100 99.2
Nebraska 89.1 89.1 100 100 100 100
Ohio 89.0 89.0 95.0 100 100 100
Alabama 88.2 88.2 84.9 87.7 100 100
New Mexico 88.2 88.2 69.2 61.3 76.7 77.9
Minnesota 88.1 88.1 83.4 90.3 92.6 95.8
Mississippi 87.8 87.8 67.4 64.1 100 82.1
Washington 87.5 87.5 99.8 91.2 84.3 92.0
North Carolina 87.4 87.4 78.8 77.9 76.7 87.0
Oregon 86.8 86.8 78.5 74.6 73.5 95.2
Alaska 86.2 86.2 100 100 100 100
Idaho 86.1 86.1 71.2 71.4 100 96.7
Arkansas 85.4 85.4 97.7 100 100 100
Maryland 85.2 85.2 100 99.4 97.1 84.4
North Dakota 83.1 83.1 87.2 86.8 100 94.9
Massachusetts 81.8 81.8 99.8 100 95.8 98.6
Utah 79.9 79.9 96.6 89.5 93.3 98.3
Colorado 79.7 79.7 86.1 84.5 80.9 91.1
West Virginia 79.0 79.0 78.0 75.3 100 92.6
New Hampshire 78.8 78.8 100 100 100 98.2
Pennsylvania 78.4 78.4 97.0 100 100 100
Wisconsin 78.0 78.0 82.7 87.7 91.4 100
Michigan 77.2 77.2 89.5 97.4 94.2 100
Oklahoma 76.3 76.3 71.2 70.2 70.1 91.6
Vermont 75.4 75.4 100 97.9 94.5 100
Montana 74.2 74.2 96.5 83.0 100 99.2
South Dakota 74.1 74.1 84.5 79.6 100 98.1
Louisiana 74.1 74.1 85.9 72.8 77.7 84.3
New Jersey 73.2 73.2 100 100 100 98.2
Iowa 72.9 72.9 87.5 81.9 100 93.7
Maine 72.3 72.3 81.4 83.8 92.4 95.2
The hotel industry in 16 states was deemed efficient in terms of its contribution to Total GDP as illustrated in the accompanying table. Please feel free to download the heat-map of efficiency scores for the Hotel Industry across U.S. states: Efficiency Score Rankings for the Hotel Industry Across U.S. States 2015
Using a paired t test we found the difference in mean efficiencies for Hotel Operations Efficiency and Direct Impact Efficiency to be not statistically significant (two-tailed P value = 0.3730). Similarly, the mean difference in mean efficiencies for Hotel Operations Efficiency and Total GDP Efficiency was found to be not statistically significant (two-tailed P value = 0.9089). The difference in mean efficiencies for Hotel Operations Efficiency and Total Tax Efficiency was found to be statistically significant (two-tailed P value 0.0115). Finally, the difference in mean efficiencies for Hotel Operations Efficiency and Total Employment Efficiency was found to be extremely statistically significant (two-tailed P value 0.0005).
Summary statistics for the DEA models are found in the following table. The average efficiency score for inefficient states of 83.5 for Hotel Operations Efficiency suggests that the average hotel industry by inefficient state is 83.5% efficient compared with the most efficient states.Descriptive Data on Efficiency Scores for the Hotel Industry Across U.S. States
Source: Hotel Investment Strategies, LLC based on an analysis of data in the report "Economic Impact of the Hotel Industry" funded by the American Hotel and Lodging Association Educational Foundation and undertaken by Oxford Economics.
Variable Hotel
Operations
EfficiencyHotel
Operations
Super
EfficiencyDirect
Impact
EfficiencyTotal GDP
EfficiencyTotal Tax
EfficiencyTotal
Employment
Efficiency
Average 88.3 187.6 89.9 88.1 93.2 94.6
Standard Deviation 9.6 274.3 10.3 11.4 9.3 6.5
Maximum 100 1000 100 100 100 100
Minimum 72.3 72.3 66.1 61.3 70.1 75.1
Average Inefficient 83.5 83.5 85.3 82.7 86.7 91.6
DEA provides more than financial measures of performance. It can:
- identify star performers to locate “best practice”
- identify under-achievers to locate “poor practice”
- set realistic, peer-based improvement targets, and uncover the largest potential efficiency gains.
The pie chart shows the relative percentages of potential improvements for each input/output. This is achieved by adding up the potential improvements for each state. The most prominent input reduction involved the number of guest rooms which were the most over-utilized resource relative to the level of output in all of the inefficient states. The movement toward efficiency requires that hotel employment be reduced by 29.6%. Choosing input minimization, the DEA solutions sometimes also indicate that some states can optimize their outputs too. The number of occupied room nights appears quite infrequently as an excess output.
Total Potential Improvements
Scroll over the pie chart to highlight data.
[visualizer id=”1038″]
The issue of productivity and efficiency should be at the heart of any hotel organization. Whether the prime aim is higher profits, higher overall shareholder value or larger market share, hotel owners and operators can substantially improve the efficiency and profitability of their hotels by employing DEA. The technique can be applied in many different ways and in many different sectors of the hotel industry.
¹ For the purpose of this study, the hotel industry was defined as including the following types of business establishments (each sector is also referenced here by the corresponding code in the North American Industry Classification System):
- hotels and motels (NAICS 721110);
- casino hotels (NAICS 721120); and,
- bed and breakfast inns (NAICS 721191).
The analysis excludes:
- short-term rentals;
- other traveler accommodations (NAICS 721199), such as guest houses and youth hostels; and,
- casinos except casino hotels (NAICS 713210).
² Direct effects: Also referred to as direct impacts. Includes direct spending and revenues, in this case from hotel operations, hotel guest ancillary spending, and capital investment; as well as the corresponding employment, income and fiscal impacts.
Indirect impacts: Downstream supplier industry impacts, also referred to as supply chain impacts. For example, hotels require inputs such as energy and food ingredients. Also can refer to indirect and induced impacts combined.
Induced impacts: Arise as employees spend their wages in the broader economy. For example, as hotel employees spend money on rent, transportation, food and beverage, and entertainment.
Fiscal impacts: Tax revenue, as well as contributions to Social Security and unemployment insurance, as well as government revenue from various fees.