In these heady times, it is easy for hotel investors to overlook the most important cornerstone of the capital markets: that expected returns are (and should be) greater for more risky assets. Hotel investors commonly believe, implicitly if not explicitly, that they are getting a higher expected return without assuming greater risk. If a hotel investor wants a higher return, the investor must generally accept more risk. The extra return for a given level of risk is the ‘risk premium’ that is necessary to induce investors to invest their money in a hotel whose cash flows are less certain.
The risk premium is also defined as that part of the hotel’s total return that reflects the level of risk over and above the risk-free rate of return which an investor could obtain from a guaranteed investment, such as a U.S. government-backed treasury security. Now the analysis of return necessitates the analysis of risk. Both must be quantified before tradeoffs between risk and return can be made.
An “ideal” hotel investment is one from which the investor expects a high rate of return relative to the level of perceived risk of the hotel. Normally, hotel investors focus with laser-like intensity on a single factor of investment success: the rate of return or internal rate of return. Most hotel models provide forecasts that are point estimates – that is, single-parameter estimates of return. But point forecasts provide no indication of the uncertainty in the number, and uncertainty is an important consideration in decision making.
If the cash flows associated with a hotel are random, then the IRR of the investment is also random. In this case the distribution of IRR’s, provides detailed insights into the risk profile of the hotel. An investor who is presented with an investment showing a 16% IRR with a 5% probability that it will be less than 11% and a 5% probability that it is likely to be above 21% IRR.
[visualizer id=”1306″]
Pellat¹ noted in 1972 that “the contemporary models of real estate investment analysis all are grossly inadequate and are incapable of generating realistic estimates of the overall rate of return on a real estate investment and the risk of that investment.” He could easily have said the same thing today!
Risk is a concept that investors, developers, and lenders associate strongly with the lodging industry, especially in light of the industry’s slump in 2001 and 2009! Many people consider investing in hotels a high-risk use of time and capital. Investors not only acquire an interest in a volatile form of real estate, but also participate in the highly specialised task of operating a service-oriented business. However, both activities affect the risks and returns associated with hotels.
Although both risk and return are acknowledged, our thinking and training emphasize the rate of return. But, if the variables affecting the risk-return relationship are more explicitly identified, quantified, and evaluated, more accurate projections can be made of the risk of a hotel investment. The stakeholders in hotels therefore need to spend as much time undertaking quantitative risk analysis as they do calculating rate of return.
Risk is defined as the probability that the expected cash flow or return will not be received. Risk exists in hotels because investors can not make perfect forecasts. If they could, they would never make an investment that would yield less than the required rate of return.
Hotel investment analysis normally provides point estimates – that is, single-parameter estimates such as IRR, debt-coverage ratio, loan-to-value ratio, and market value. Point estimates are the most probable numbers, not the only possible numbers. Recognising and dealing with other possibilities is a major function of risk analysis.
The debt-coverage and loan-to-value ratios provide some information about the risk profile of a hotel. They do not, however, provide information about the probable deviations from the most likely values used in the analysis. A complete risk analysis provides information on the magnitude of possible deviations in cash flow that can occur under varying market and economic conditions and the probability associated with each of these projections.
Exhibit 1 illustrates the possible values for a debt-coverage ratio and displays the uncertainty inherent in the results. It clearly illustrates the small probability that the debt-coverage ratio will be less than 1. Although the mean debt-coverage ratio is 1.3 there is a 6.7 per cent probability that the debt-coverage ratio will be less than 1.

None of the risk ratios currently being used by lenders and investors to assess hotel investments provide this type of information. Most market and financial models used in hotel investment analysis are deterministic, a specific value for each input variable being used. Risk analysis models are said to be probabilistic when the values of many of the input variables are uncertain and are defined as ranges with associated probability distributions, rather than as single-point estimates.
“What if?” or sensitivity analysis is the most commonly used “risk analysis” technique in hotel investment analysis. It reveals the relative sensitivity of returns to different variables by changing one or more of the values for the uncertain variables. For example, how would a lower occupancy rate in the first two years affect the projected IRR?
Assumptions that are typically examined in a sensitivity analysis include growth in RevPAR, stabilized occupancy and ADR, labor expenses, capital expenditures and the terminal capitalization rate. At best, sensitivity analysis is a crude analysis of risk because it fails to take into account the probabilities associated with all possibilities.
For this reason, Hotel Investment Strategies uses Monte Carlo simulation techniques for hotel investment analysis and has used these techniques for over twenty-five years.
Monte Carlo Simulation
Monte Carlo simulation was developed in the early 1960’s; one of its first proponents was David Hertz, whose classic article² in the Harvard Business Review did much to bring the technique to a wider audience.
The Monte Carlo technique attempts to imitate the various ways in which all the variables influencing the investor’s rate of return could combine as the complex future unfolds.
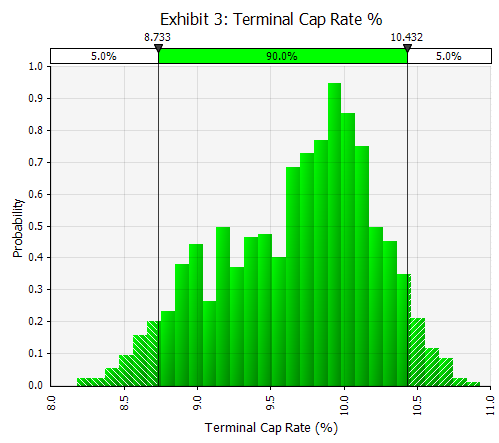
Probability distributions, such as those illustrated in Exhibits 2 and 3, are used instead of point estimates for the uncertain variables. Ranges of probability can be determined with at least four methods including historical observations, controlled experiments and observation, theoretical distributions and subjective judgement.
For example, rooms payroll per occupied room is illustrated in Exhibit 2 by a lognormal distribution with a mean of $24 and a standard deviation of $2. An analysis of historical data has provided the basis for the type of distribution used for rooms payroll.

Exhibit 3 illustrates an example combining four different expert opinions on the likely terminal cap rate where one expert (EVP Acquisitions) might be given twice the weight of the others due to his greater experience.
Probability distributions are derived for all of the uncertain variables including interest rates, market segment growth rates, department expenses, refurbishment costs, and future competition. The possible combinations of the values for each factor are then simulated to determine the range of possible outcomes and the probability associated with each. In this way, Monte Carlo techniques estimate the probability as well as the magnitude of potential risks, thus providing a complete risk analysis.
The technique overcomes the limitations of both sensitivity analysis and best case/worse case analysis. For this reason, Monte Carlo simulation should be the preferred risk analysis technique for hotel investment decisions, since it provides the best possible information on the risk-return profile of a lodging investment.
Exhibit 4 shows the distribution of possible IRR’s for a hotel investment. The height of each bar represents the probability that the outcome will occur in the range of the bar.

Exhibit 5 provides the statistical output for the analysis. As illustrated, the probable unleveraged IRR’s range from a minimum of 10.5% to a maximum of 20.8% with a mean of 15.5%. The percentile value indicates the percentage of the generated results that are less than or equal to the associated value. For example, the 35th percentile value for the IRR, is 14.7%, means that there is a 35% probability that the investor will receive a return of less than or equal to 14.7%.
Conversely, there is a 65% probability the investor will receive a return of 14.7% or better. The analysis clearly illustrates the risk-return profile of the hotel and enables the investor to evaluate the expected returns and the risks of the investment.

The same type of analysis can be undertaken for any output the stakeholders are interested in. The analysis generates a range of possible returns rather than a single value and also computes the probability of receiving different rates of return, depending on how the future unfolds.
Ranking analysis identifies and ranks the most important sources of risk as shown in the tornado graph in Exhibit 7, with the longer bars representing the most significant input variables. The regression coefficients provide a measure of how much the output (in this case unleveraged IRR) would change if the input were changed by one standard deviation.
This type of analysis enables the investor to focus on the more significant risks, saving the time and money that might be expended on an analysis of less important factors. The objective is to identify significant risks that must be managed and to screen those minor risks that can be accepted and so excluded from further consideration.

Scenario analysis identifies combinations of input variables that are the most important in causing a given output to achieve a user-specified target. For example, which variables contribute to a debt coverage ratio greater than 1.4 ? Or, which variables contribute to profits below $1 million?
In summary, Monte Carlo simulations provide considerable information about the hotel investment being analyzed, including:
- The likely range of outcomes the investor can realistically expect.
- The probability of exceeding a target result.
- The relative magnitude of various sources of uncertainty.
- The sensitivity of the model’s results to uncertainty in each input, thus highlighting the major risk factors.
The use of risk simulation models by the stakeholders in hotels can have a substantial effect on their investment decisions. The model outlined can help decision-makers to accommodate and weigh information about the risk characteristics of hotel investments and perhaps avoid unwise investments or make investments where the risk-return trade-offs are known and acceptable. If you would like more information on Monte Carlo simulation and its application in hotel investment analysis, please contact us and request a complimentary copy of “Quantitative Risk Analysis for Hotel Investors”.
- Pellat, P.G.K.: “The Analysis of Real Estate Investments Under Uncertainty”, Journal of Finance, Vol 27, No.2, p.459.
- David B. Hertz. “Risk Analysis in Capital Investment,” Harvard Business Review, Vol. 42, No.1 (1964): 95-106