While U.S. hotel profits reached an all time high of $80 billion in 2018, many hotel owners and managers are now turning their attention to cost containment and revenue management initiatives as expenses, such as labor costs, have begun to grow at higher rates than revenues. Maintaining profitability will be a challenge in the next couple of years with stable occupancies, modest rate increases and low unemployment leading to a diminished labor pool and higher wages. As a result, a growing number of hotel investors have recently investigated the use of a sophisticated linear programming technique called DEA, or data envelopment analysis, a technique we have customized for use in the lodging industry. The technique is also called balanced benchmarking.
The use of DEA uncovers significant peer-based improvements and cost saving opportunities not identified by traditional financial and operating ratio analysis used in the lodging industry. Why? Because it calculates efficiency based on observed best practice – not on “average” or “comparable” data, and simultaneously accounts for the interactions and substitutions between multiple inputs (e.g., FTEs, housekeeping payroll & related and laundry, linen and supplies) and multiple outputs (e.g., rooms cleaned, inspection reports, absenteeism and guest satisfaction). Single-factor productivity measures, which are the staple of current operating ratio analysis used in the lodging industry, are unable to do this!
Financial ratios, probably the most widely used measure of hotel performance, provide information on the overall financial performance of a hotel, but provide little in the way of tangible information about the amount by which performance might be improved or the area or areas where effort should be focused in order to improve performance. To make improvements, realistic and achievable improvement targets have to be identified with sufficient information for managers to be able to work towards them. This is where DEA comes in. For further details on DEA please feel free to download our article on DEA.
The following case study is drawn from a major consultancy undertaken in early 2019 for a client whose name and specific details remain confidential under our agreement. However, our client was kind enough to allow us to release a small sample of our results from our larger study. This small sample demonstrates some of the effective working insight that we can provide to improve the profitability of any hotel portfolio. It gives practical applications of DEA and highlights some of the benefits of its use in the lodging sector.
We are therefore pleased to provide a brief report on the efficiency rankings and targeted peer-based improvements and expense savings on a 46 mid to upscale hotel portfolio which is primarily located in mid-west and eastern seaboard states.
The client wanted an efficiency ranking to develop a profitability/efficiency matrix which categorized the hotels into four groups: hotels that had the potential for greater efficiency and profit (Question Marks), hotels that were profitable but inefficient (Sleepers), hotels that were both profitable and efficient (Stars) and the hotels that were efficient with low profitability (Dogs).
The client wanted to use the outputs of our work to increase the overall profitability of the portfolio by optimally allocating asset management resources and developing a disposition/retention strategy. In addition, the client sought to:
- Identify star performers to locate “best practice”
- Identify under-achievers to locate “poor practice”
- Set realistic, peer-based improvement targets, and
- Uncover the largest potential efficiency gains
The hotel portfolio consists of 46 midscale to upscale hotels located in 18 states, primarily in the Midwest and on the eastern seaboard. Nine hotels are in Ohio, five in each of Connecticut and Pennsylvania and four in Maryland. By chain scale, the hotels are split Upscale (19), Upper Midscale (24) and Midscale (3). The brands represented in the portfolio include: Candlewood Suites, Comfort Inn & Suites, Courtyard, Fairfield Inn, Hampton Inn, Hampton Inn & Suites, Hilton Garden Inn, Holiday Inn, Holiday Inn Express, Holiday Inn Express & Suites, Home2 Suites, MainStay Suites, Residence Inn, SpringHill Suites and TownePlace Suites.
The portfolio consists of hotels that range in size from 75 to 190 rooms, with an average size of 108 rooms. Other descriptive statistics for the portfolio are outlined below.
Descriptive Statistics for the 46 Hotel Portfolio

With more traditional approaches to performance measurement, such as ratio and regression approaches, it is possible to provide a graphical representation of the results. It is also possible with DEA to produce a graphical representation of the results, but only in situations with one input and two outputs, or two inputs and one output. Beyond this, the graphical representation would be in n-dimensional space.
The graphical representation below helps explain the principles of DEA and is used to illustrate:
- The construction of the efficiency frontier
- How “best practice” hotels are identified
- The performance gap between “best practice” hotels and under-performers
- How benchmarks can be set for under-performers, and
- The setting of performance targets for under-performers
The efficiency frontier is the frontier (envelope) representing “best performance” and is made up of the hotels in the portfolio which are most efficient in transforming their inputs into outputs. The hotels that determine the frontier are those classified as being 100% efficient. With one input and two outputs, the efficiency frontier is constructed in three steps as follows:
Step 1: With one input (Rooms Expenses in our case) and two outputs (Total Revenue and Rooms Occupied), we plot the values of outputs obtained with the defined input as illustrated below.
Location of the 46 Hotels in Relation to the Efficiency Frontier with One Input (Rooms Expenses) & Two Outputs (Total Revenue & Rooms Occupied)

Step 2: We then identify the hotels giving maximum outputs with the given amount of inputs. These hotels form the efficiency frontier. In the diagram above we find that the Holiday Inn S and Hilton Garden Inn R form the efficiency frontier and are deemed 100% efficient. Hotels located within the frontier or envelope (i.e. in the region of under-performance) are found to be inefficient.
Step 3: We identify targets for the inefficient hotels by drawing a straight line from the origin, through the inefficient hotel to the frontier. In the example above the line is drawn through Hampton Inn & Suites M to the frontier, which is the target for the hotel.
Virtual Hampton Inn & Suites M on the efficiency frontier, is representative of an efficient hotel, albeit an imaginary one, the characteristics of which demonstrate the improvement in output needed to move the Hampton Inn & Suites M from its current position, onto the efficient frontier at the point with the star.
The imaginary hotel at this point is referred to as a composite or virtual hotel. An efficiency measure can be calculated from this graph by calculating the ratio of the distances between the origin and current location of the Hampton Inn & Suites M and the origin and target location on the efficiency frontier. The potential for improvement can be quantified and under-performers assigned appropriate benchmark partners.
The illustration above also highlights the existence of “peers” for the inefficient hotels. The Holiday Inn S and the Hilton Garden Inn R are clearly potential peer hotels for the Hampton Inn & Suites M. Further peer hotels were identified as a result of the simultaneous evaluations of all inputs and outputs and included Hampton Inn B and Residence Inn W. Recall that DEA simultaneously considers the multiple resources used to generate multiple outputs.
Although the composite hotel (which sets the targets for the improvement of an inefficient hotel) is a combination of its peer hotels, the peers do not necessarily contribute equally to the construction of the composite hotel.
Three Dimensional Representation of Two Outputs (Total Revenue & Rooms Occupied) and Two Inputs (Rooms Expenses & Sales & Marketing Expenses

DEA results in each hotel being allocated an efficiency score between zero (0%) and 1 (100%). A hotel with a score of 100% is relatively efficient, a hotel with a score of less than 100% is relatively inefficient. Scores are relative not absolute, as they are relative to the other hotels in the portfolio.
Twenty-three of the 46 hotels had an overall efficiency of 100% based on the simultaneous evaluation of two outputs (rooms occupied and total revenue) and six inputs (rooms expenses, other department expenses, sales and marketing expenses, A & G expenses, PO & M expenses and energy & utilities expenses. The remainder had overall efficiencies ranging from a high of 99.4% to a low of 58.9%.
Any hotel with a score of less than 100% is relatively inefficient, e.g. a hotel with a score of 80% is only 80% as efficient as the best performing hotels in the portfolio. An inefficient hotel should be able to produce its current level of outputs with fewer inputs or generate a higher level of outputs given the same inputs when compared with the actual achieved performance of other hotels in the analysis.
As illustrated in the rankings below, 23 hotels were found to be efficient and 23 were evaluated to be inefficient in terms of overall efficiency. Fourteen hotels had an efficiency score in the 91 and 99.9 range and six had an efficiency score of between 81 and 90. Three hotels had an efficiency score of 80 or less.
When using the variable returns to scale model (i.e. pure technical efficiency), a larger number of hotels were found to be efficient. This variation indicated the existence of diseconomies of scale within operations of individual hotels. The average variable returns to scale was found to be 97.8% compared to 94.8% for constant returns to scale efficiency.
Efficiency Rankings for the 46 Hotel Portfolio

Note: Maximum Efficiency Score = 100. Please refer to the footnote for definitions of the efficiency terms.
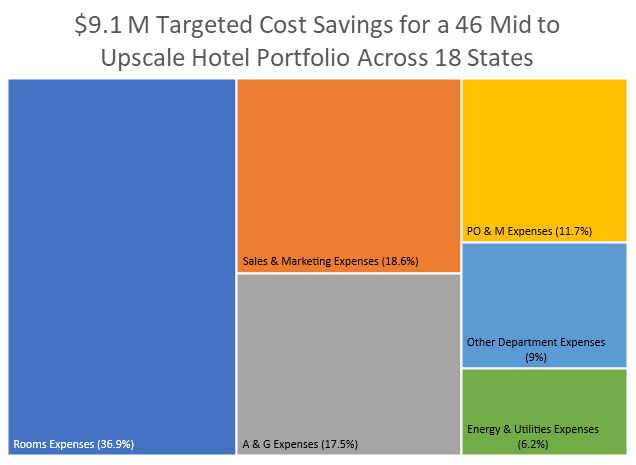
Our detailed analysis identified targeted expense savings of $9.1 million, or about $397,000 per inefficient hotel on average with a range from $62,000 to $1.1 million. The largest targeted expense savings were found in the Rooms Department ($3.4 million), followed by Sales & Marketing ($1.7 million) and A & G ($1.6 million). The distribution of targeted expense saving is illustrated below.
$9.1 Million Targeted Expense Savings – 46 Hotel Portfolio

The highest priority hotels for immediate remedial action for all expenses include Hampton Inn S ($1.1 million), Hampton Inn & Suites M ($1.1 million), Courtyard L ($0.6 million), Hampton Inn P ($0.6 million) and Springhill Suites B ($0.6 million). The five hotels account for almost $4 million or about 43% of the targeted expense savings for the portfolio. The top 10 account for 68% of the total. The distribution of targeted expense savings for the 16 highest priority hotels is illustrated below.
$8.2 Million Targeted Cost Savings for 16 Hotels – 90% of Total

An important feature of DEA is the ability to identify efficient hotels, the reference set, which can be examined in order to identify appropriate targets for inefficient hotels to work towards. In the example above, the composite hotel, Virtual Hampton Inn & Suites M appears to be closer to its peer hotel Holiday Inn S, than peer hotel Hilton Garden Inn R. The composite hotel is more representative of the Holiday Inn S. Therefore, the input/output mix of Holiday Inn S was used as its target.
Charged with interpreting and interpreting the results of our DEA analysis, we critically reviewed the operating practices of both the efficient and inefficient hotels, to determine the best course of action in order to bring about improved performance.
Surprisingly, productivity analysis of lodging facilities is still performed using measures that fail to capture the complexity of today’s operations. Traditional partial-factor productivity measures do not account for relationships among input resources. Labor productivity, in particular, is often used as a surrogate for overall operational performance, without regard to other relevant variables.
DEA is a technique that allows for measurement of the relative efficiency of hotels and departments. Its main strength lies in its ability to capture the interplay between multiple inputs and outputs, a process that cannot be satisfactorily probed through traditional ratio analysis which forms the basis of the lodging industry’s benchmarking efforts.
Purely financial measures of performance are no longer sufficient to ensure long-term competitiveness. Our analysis takes the data for exiting performance measurement systems and uses a mathematical technique to combine all the performance ratios into a single efficiency score. More importantly, it tells you where your hotels can improve – based on the performance of their peers. This means that the targets for improvement are objective, realistic and achievable.
Efficiency is defined as the weighted sum of the outputs produced by a process, divided by the weighted sum of the inputs used by the process.
Overall efficiency or sometimes called aggregate efficiency refers to the extent to which a hotel achieves overall productivity attainable in the most efficient manner. A hotel is said to be technically efficient if it maximizes output per unit of input used. Technical efficiency is the efficiency of the production or conversion process and is calculated independently of prices and costs. The impact of scale size is taken into account as hotels are compared only with hotels of similar scale sizes.
A hotel is “scale efficient” when its size of operation is optimal. If its size of operation is either reduced or increased its efficiency will drop. A scale efficient hotel is operating at optimal returns to scale.