Indonesia’s hotel sector has drawn the short straw in terms of domestic tourism expenditure, capturing Rp 16.29 trillion or just 6.4% of total domestic expenditure of Rp 253.47 trillion in 2017. This compares with Rp 79.83 trillion or 40.1% of total foreign tourism expenditure of Rp 198.89 trillion in 2017.
Despite the robust growth in domestic tourism expenditure as illustrated in the graph below, (10-Year CAGR 8.8% & 5-Year CAGR 9.3%), the hotel sector has captured a declining share of domestic tourism expenditure over the past five years.
The Growth of Domestic Tourism & Expenditure in Indonesia, 2007-2017

Statistik (BPS)
Restaurants and other food and beverage outlets are the main beneficiaries of domestic tourism expenditure capturing 30.2% in 2017 as illustrated in the graph below. Shopping, which excludes souvenir, beauty and health purchases is the second largest expenditure category at 16.7%.
Air transportation is the third largest category at 14.2%. The other transportation categories, train, highway, water and car rental capture 14.7% of total domestic tourism expenditure.
The Structure of Domestic Tourism Expenditure in Indonesia, 2017
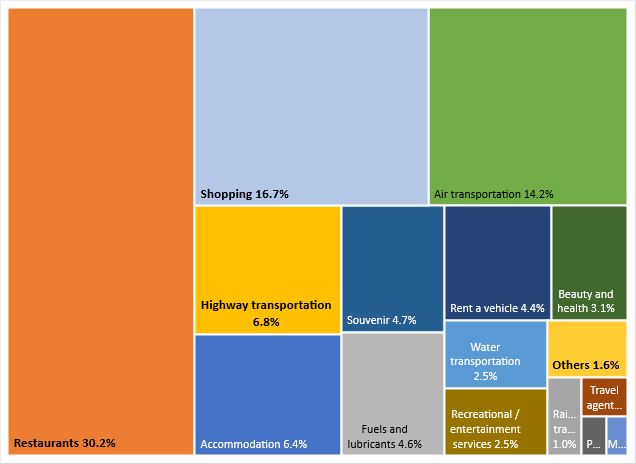
Source: Neraca Satelit Pariwisata Nasional (Nesparnas) Tahun 2017 – Badan Pusat
Statistik (BPS)
The propensity of different provinces in Indonesia to generate domestic tourism trips and therefore tourism expenditure varies greatly. The ten largest provinces for generating tourism expenditure are listed in the graph below.
Jawa Barat generated just over 12% of domestic tourism expenditure in 2017, followed by DKI Jakarta (10.9%), Jawa Timur (8.1%) and Jawa Tengah (6.1%). The provinces not listed generated just over 51% of domestic tourism expenditure in 2017.
Origin of Domestic Tourism Expenditure in Indonesia by Major Provinces, 2017

Source: Neraca Satelit Pariwisata Nasional (Nesparnas) Tahun 2017 – Badan Pusat
Statistik (BPS)
While the Province of DKI Jakarta generated about 10.9% of domestic tourism expenditure in 2017, it received 20.2% or a surplus of domestic tourism expenditure in 2017. Jawa Timur captured 16% of total domestic tourism expenditure, followed by Jawa Barat (15.2%), Jawa Tengah (13%) and DI Yogyakarta (6.4%).
While the other provinces not listed in the graph generated about 51% of domestic tourism expenditure in 2017, they only captured 13.5% of total domestic tourism expenditure in 2017.
Destination of Domestic Tourism Expenditure in Indonesia by Major Provinces, 2017

Source: Neraca Satelit Pariwisata Nasional (Nesparnas) Tahun 2017 – Badan Pusat
Statistik (BPS)
Of the ten largest generating provinces for domestic tourism expenditure, only Sumatera Utara and Sumatera Bara experienced a deficit in domestic tourism expenditure in 2017. The remaining eight provinces were the major beneficiaries of domestic tourism expenditure generated by the other provinces not listed as well as Sumatera Utara and Sumatera Bara.
It interesting to note that Bali, the major destination for international visitors to Indonesia, generated 1.7% of domestic tourism expenditure in 2017, but captured 4.5% of total domestic tourism expenditure in the same period.
The Difference Between the Origin & Destination of Domestic Tourism Expenditures by Province 2017

Source: Neraca Satelit Pariwisata Nasional (Nesparnas) Tahun 2017 – Badan Pusat
Statistik (BPS)
Check back in the very near future as we plan to provide a similar analysis on the structure of foreign tourism expenditure in Indonesia and the contribution of the 10 largest source markets for international tourism in Indonesia.