Indonesia’s burgeoning middle class and rising disposable income are having a major impact on the country’s restaurant industry. Assisted by the growth in international visitors, which have grown from 5.5 million in 2007 to 14 million in 2017, (as illustrated in our recent report, “Short-Term Forecasts of Visitor Arrivals in Indonesia, 2018-2020”), the restaurant industry is set for solid growth over the next three years, 2018 – 2020. Rising consumer spending and changing dining habits of millennials are also having a positive impact on the demand for full-service restaurants. While the industry is highly fragmented, international franchise companies continue with their aggressive expansion plans. While profit margins have grown from about 21% in 2000 to around 30% in recent years, there is concern that service standards and productivity levels lag behind the growth in new restaurants, leading to less efficient operations and sub-optimal industry performance. The same has been said of the country’s hotel industry, which we have briefly addressed in an earlier blog, Star-Rated Hotel Efficiency In Indonesia: A Provincial Analysis Using the Data Envelopment Analysis (DEA) Technique. Our analysis therefore examines restaurant productivity across Indonesia’s provinces using 2015 data, the latest year for which data is available and the data envelopment analysis (DEA) technique.
DEA is a nonparametric, multifactor productivity analysis tool that evaluates multiple input and output measurements simultaneously and produces one single measure of performance in evaluating the relative efficiencies of decision-making units (DMUs) or restaurants in our case. DEA accounts for both controllable and uncontrollable (environmental and situational) factors in evaluating a firm’s productivity/efficiency. It can therefore address management performance, unhindered by factors beyond the control of management.
In this brief analysis, we measure the efficiency of restaurants in Indonesia from a macro perspective by examining provincial data from the report “Statistik Restoran / Rumah Makan 2015” published BPS – Statistics Indonesia. By using provincial data from a macro perspective, our results provide Indonesian tourism policymakers and restaurateurs with an alternative method for gauging restaurant performance on a provincial basis. Furthermore, the DEA results could pinpoint areas and resources (inputs) that are in need of improvement and further investigation, in order to enhance productivity/efficiency and hence deliver better performance.
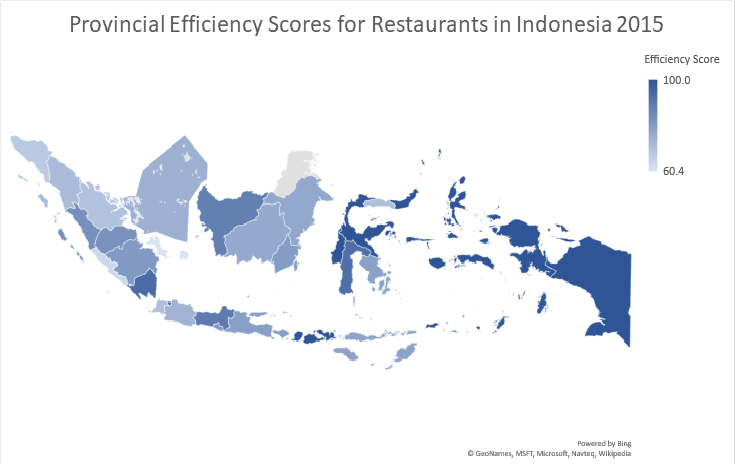
Using three inputs: average expenditure, average workers compensation and average seat capacity and two outputs: average income and average guests per day, we developed an input-oriented DEA analysis of 33 provinces under variable returns to scale (VRS) assumptions. Our analysis reveals that restaurants in eight provinces (Maluku Utara, Nusa Tenggara Barat, Maluku, Papua, Papua Barat, Sulawesi Barat, Sulawesi Utara, and Sulawesi Tengah) had the highest technical efficiency scores at 100 relative to other provinces in 2015 as illustrated in the accompanying map and the table below. Restaurants in the provinces of Bangka-Belitung, Bengkulu, Aceh, Riau, and Gorontalo had the lowest efficiency scores in 2015. Bali’s efficiency score at 79.5 is surprising given its focus on culinary tourism.

Our analysis provides potential percentage improvements for the inputs (resources) and outputs for each of the inefficient provinces in order that they achieve an efficiency index of 100. In aggregate, restaurants in the inefficient provinces would need to achieve a reduction of 26% in average expenditure, a 32% reduction in average workers compensation and a 25% reduction in average seat capacity to achieve an efficiency index of 100.
While this brief analysis evaluated the performance of the Indonesian restaurant industry from a macro perspective, individual restaurant owners and managers could examine their restaurant portfolios from a micro perspective by assessing the management and operations of individual restaurants. Prospective controllable inputs could include number of seats in the restaurant, number of employees (full-time equivalents), server hours, training, etc., uncontrollable inputs could include number of competitors, years open, number of parking spaces, servers wage and potential outputs could include income, sales and number of guests served per day. Such an analysis is likely to provide detailed insights for enhancing the performance of restaurants in Indonesia.
Our Efficiency & Productivity Benchmarking Services using DEA has radically transformed the way a number of restaurant chains have measured performance in the restaurant and fast food industries. Please contact us if you believe we can be of assistance.