“What are the best hotel markets in Australia – primary, secondary or tertiary”, “What are the best lodging classes – luxury & upper upscale, upscale & upper mid or midscale & economy”, and “What are the best capital city and large regional hotel markets – Sydney, Melbourne, Brisbane, Gold Coast, Adelaide, Perth, Hobart, Darwin, Canberra or Cairns?’
These are among some of the questions we have been asked in recent times by clients seeking to reposition and expand their portfolios, despite the downturn in the country’s tourism industry caused by the COVID-19 pandemic. We usually seek to understand what our clients mean by ‘best’ because the term means different things to different people. Are they developers seeking development opportunities or are they investors seeking value-add or opportunistic type returns? What is their investment horizon and their appetite for risk?
Constructing a hotel portfolio by evaluating the risk and return for individual hotels is unlikely to guarantee that an optimum portfolio will be obtained. Indeed, any new hotel that is being considered as an addition to a portfolio should be judged on the grounds of “efficiency”; that is, whether its addition to an existing portfolio will increase expected portfolio returns while maintaining or lowering portfolio risk. As such, many hotel investors are focusing on how much of their returns they should expect from beta and how much from alpha!
If you would like to receive our Australian posts, please fill out the subscription form at the end of this post.
Alpha & Beta Returns
Hotel investors commonly believe, implicitly if not explicitly, that they are getting a higher expected return without assuming greater risk. Clearly, every hotel investor is interested in investments with a weak – and therefore favorable – relationship between the expected rate of return and the expected level of risk. Most seek positive “alpha”, the measure of a hotel investment’s return over the market’s return. While most hotel investors think they can produce positive alpha, the sum of alpha in a market is zero, so if one investor wins, another looses!
In recent years beta has become a synonym for market movement or exposure. Receiving a return from beta in a portfolio construction context means getting return from being exposed to a segment, such as luxury hotels or a market.
Seeking the highest risk-adjusted returns, hotel investors use a range of techniques, including DCF analysis to try and distinguish between “superior” investments (i.e., more return per level of risk) and “inferior” investments (i.e., less return per level of risk). Without an empirical framework of market equilibrium however, it is doubtful whether hotel investors can consistently outperform the market, other than by chance!
A useful starting point is an analysis of the historical growth in RevPAR performance of hotel chain scale segments, hotel location segments and hotel regions over the past five (2015-2019), ten (2010-2019) and thirty-one year periods (1989-2019) as illustrated in this article. Lacking a comprehensive return series for hotel real estate investment, we have used RevPAR growth rates from the Australian Bureau of Statistics and STR, Inc. While RevPAR growth rates are not a complete measure of hotel real estate returns, they are significantly correlated.
RevPAR growth has been used historically as a reliable indicator to measure the potential for hotel profit growth. Robert Mandelbaum, a Director of Research Information Services for CBRE Hotels’ Americas Research, found that there was an 86% correlation between annual changes in RevPAR and gross operating profit (GOP) from 1960 to 2016. An excellent article by STR titled “How RevPAR growth translates into profits” illustrates that a 1% increase in RevPAR equates to a 1.5% – 2% increase in gross operating profits per room. We can conclude therefore that changes in RevPAR provide a very strong indicator of changes in GOP.
The risk-adjusted RevPAR measure is designed to determine whether a hotel market or segment’s RevPAR growth compensates for its volatility. Although hotel segments and markets may have similar historic or projected RevPAR growth rates, the volatility of their respective RevPAR growth rates may be different, which leads to different risk-adjusted returns.
Capital City & Top Regional Hotel Markets
It may come as a surprise to many that Hobart recorded the highest average annual RevPAR growth rate over the past thirty-one years at 4.32% among the top ten hotel markets in the country as illustrated in the table below. While the market recorded the highest average annual growth rate, it experienced the third lowest risk, measured by the standard deviation of annual RevPAR growth. The market recorded the highest risk- adjusted RevPAR growth rate over the past thirty-one years. Other top performing markets over this extended period include Canberra, Adelaide and the Gold Coast.
Hobart was also the top performing market over the past ten years (2010-2019) in terms of risk-adjusted RevPAR growth, followed by Sydney, Cairns and the Gold Coast. It also out-performed the market over the past five years in terms of risk-adjusted RevPAR growth eclipsed by Cairns for the top performing market. The Gold Coast and Adelaide followed in third and fourth place.
Summary Statistics for Capital City & Top Regional Hotel Markets 1998-2019

Beta is a measure of a hotel market’s market-related (or systematic) risk because it measures the volatility of the annual RevPAR growth rate that is related to the overall volatility of the investable universe (Total 10 Markets) annual RevPAR growth rate. Note that beta for the Sydney market was 1.40 for the past thirty-one years. This means that on average a one-percent change in the aggregate total 10 market’s RevPAR growth was associated with a 1.4 percent change in the Sydney’s RevPAR growth rate. This compares with the lowest beta of 0.24 for the Cairns market.
A beta of 1 indicates that a market/segment has a risk level equal to that of the investable universe or nation, and that the market/segment’s RevPAR growth rate will mirror the movement of RevPAR for the investable universe or nation. A beta of less than 1 tells an investor that a hotel market/segment is less volatile than the overall hotel industry, while a beta higher than 1 signifies a risk level higher than that of the nation. The markets of Sydney, Brisbane, Perth and Melbourne have therefore been the most volatile. Have these markets recorded the highest ex-post and ex-ante going-in cap rates and IRR’s? Cairns, Hobart, Canberra and Adelaide have been the least volatile markets over this extended period.
The markets of Gold Coast, Darwin, Sydney and Cairns have been the most volatile markets over the past five years as demonstrated by their high betas while Hobart, Perth, Canberra and Brisbane have been the least volatile.
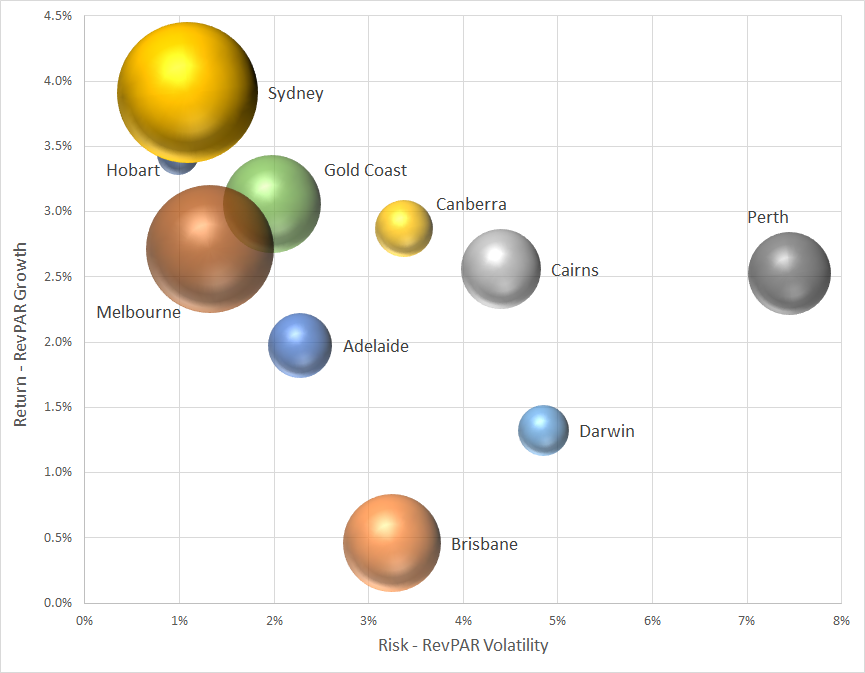
For the purposes of assisting our clients we normally examine the historical as well as forecast data on a rolling basis taking into account our client’s typical holding periods which may run from five to fifteen years. The following graph illustrates the location of Australia’s hotel markets in risk and return space for five-year holding periods ending 2010 to 2019.
The Location of Australian Hotels Markets in Risk & Return Space for Five-Year Holding Periods Ending 2010 – 2019
If you would like to find out more on the way we can assist you identify the markets most suitable for your portfolio, please contact us at +61 466 017 823 or by email. Please refer to our hotel market selection and targeting services.