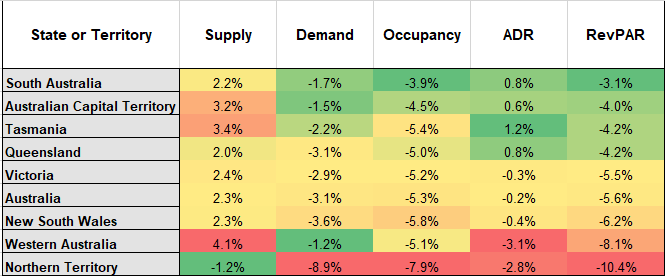
According to our analysis of the Australian Accommodation Monitor, which includes hotels, motels, serviced apartments and holiday cabins, the total supply stock of accommodation for Australia has grown at the compound annual growth rate (CAGR%) of 2.3% since 2015-2016 as illustrated in the table below.
At the same time, the demand for Australia’s accommodation stock has declined at a CAGR of 3.6%, reflecting the dramatic fall of 18.4% in 2019-2020 due to the COVID-19 pandemic.
Growth of Accommodation Market Metrics for States & Territories 2016-2017 to 2019-2020
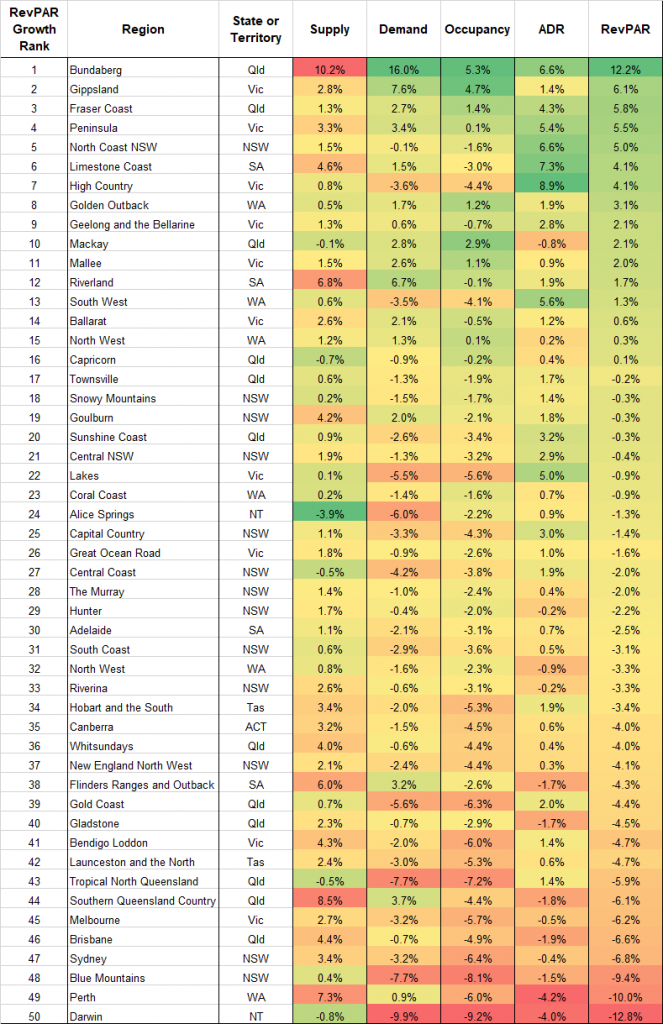
The table below provides the growth in market metrics for the Top 50 regional destinations in Australia; supply, demand, occupancy, ADR, and RevPAR. The top-performing regions in terms of RevPAR CAGR% over the past four years are, Bundaberg, (12.1%), Gippsland (6.1%), Fraser Coast. (5.8%), and Peninsular (5.5%).
The bottom performing regions were Darwin (-12.8%), Perth (-10%), Blue Mountains (-9.4%), and Sydney (-6.8%), again reflecting the different impacts of the pandemic across the country. We trust you enjoy the read.
Growth of Accommodation Market Metrics for Australia’s Major Regional Destinations 2016-2017 to 2019-2020
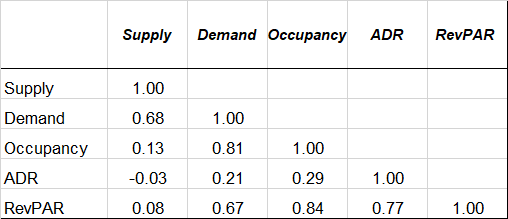
Correlation of the Growth in Accommodation Market Metrics for Australia’s Major Regional Destinations 2016-2017 to 2019-2020